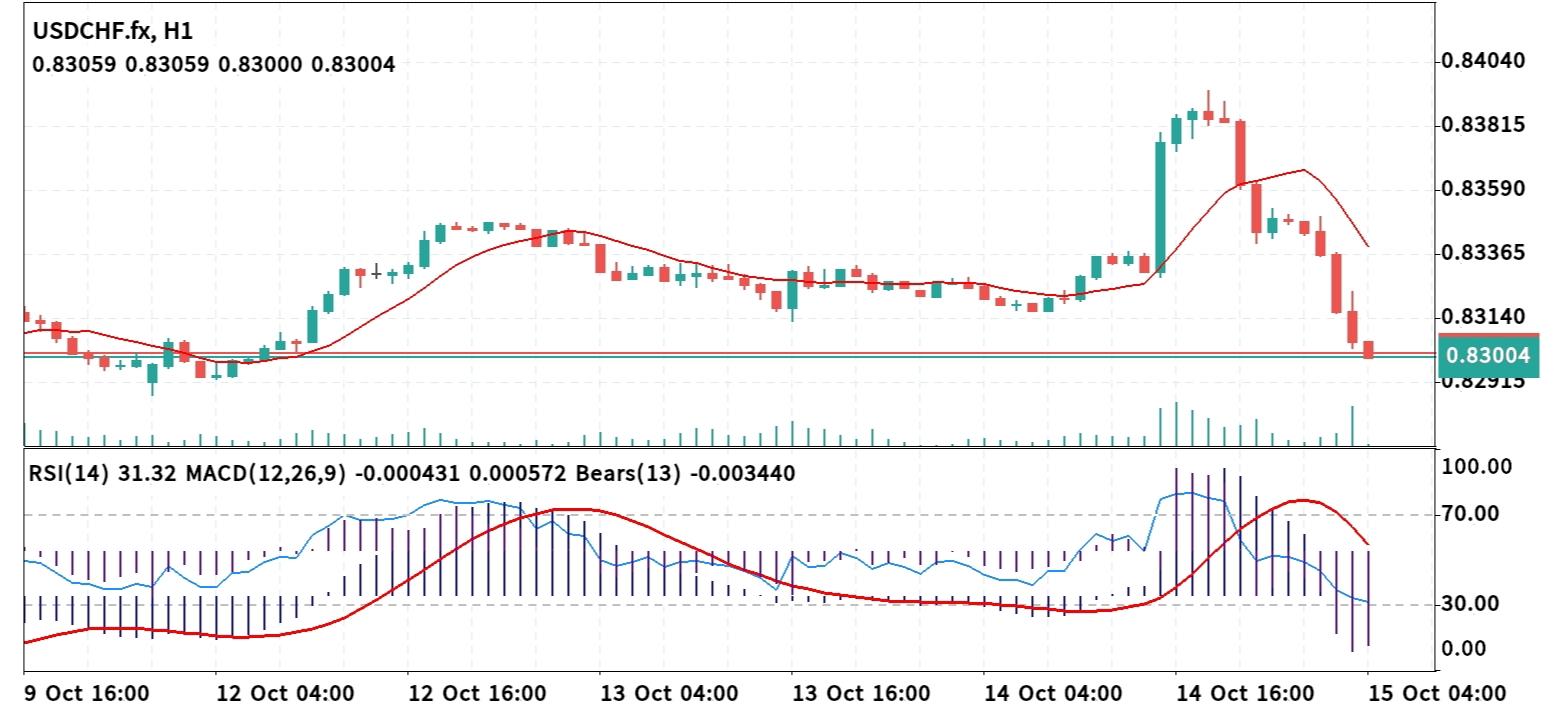
 Technical Analysis 15 October 2026 USD/CHF H-1
 The USD/CHF 1-hour chart exhibits a aggressive sell-off following a recent spike to peak highs near 0.83815. Price action has plunged sharply beneath its moving average and is now probing key horizontal support near 0.83004, presenting well-defined breakdown and mean-reversion trade opportunities. 1. Core Price Action & Structure * Current Price: 0.83004 * Immediate Resistance Zone: 0.83140 – 0.83365 (Key horizontal hurdle and moving average barrier where selling pressure intensified). * Immediate Support Zone: 0.82915 – 0.82700 (Crucial demand region representing previous base low support). * Moving Average Dynamic: Price is trading well beneath its downward-sloping short-term moving average line, confirming strong bearish intraday momentum on the hourly timeframe. 2. Indicator Confluence * Relative Strength Index (RSI - 14): Currently sitting at 31.32. This indicates heavy bearish momentum approaching oversold territory, suggesting downside pressure is strong but nearing potential short-term exhaustion. * MACD (12, 26, 9): Positioned at -0.000431 / 0.000572 with expanding negative histogram bars, confirming accelerating downward momentum. * Bears Power (13): Reads -0.003440, demonstrating dominant seller control during the current session. 3. Strategic Entry Scenarios Scenario A: Bearish Breakdown (Short Entry) * Entry Trigger: A clean 1-hour candle close below 0.82915 or a shallow retest into the 0.83140 resistance level. * Stop Loss: 0.83365 (placed safely above immediate moving average resistance). * Take Profit Targets: * Target 1: 0.82700 * Target 2: 0.82450 Scenario B: Oversold Reversal (Long Entry) * Entry Trigger: A decisive 1-hour bullish rejection candle closing back above 0.83140, capitalizing on oversold RSI conditions for a correction. * Stop Loss: 0.82915 (placed below the recent spike support low). * Take Profit Targets: * Target 1: 0.83365 * Target 2: 0.83590 Risk Management Note While negative MACD and Bears Power favor further downside, the RSI at 31.32 signals approaching oversold conditions near horizontal support. Avoid entering market sell orders directly at support. Wait for a verified hourly close below 0.82915 or a retest near 0.83140 before executing orders. Always maintain a risk-to-reward ratio of at least 1:2.
*The market analysis posted here is meant to increase your awareness, but not to give instructions to make a trade
 Italiano
 Русский
 English
 Bahasa Indonesia
 Bahasa Malay
 ไทย
ไทย Español
 Deutsch
 Български
 Français
 Tiếng Việt
 中文
中文 বাংলা
বাংলা हिन्दी
 Čeština
 Українська
 Română
