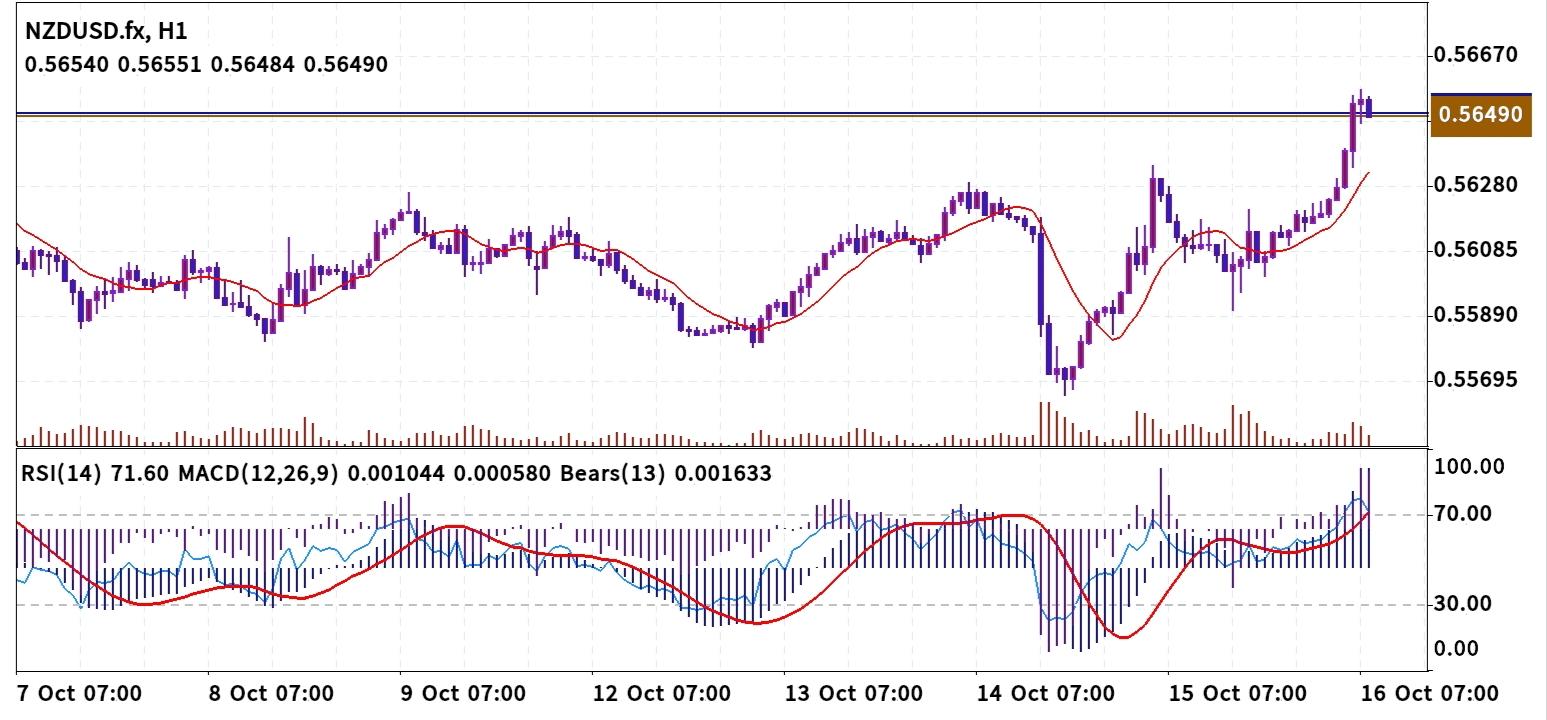
 Technical Analysis 16 October 2026 NZD/USD H-1
 The NZD/USD 1-hour chart displays a strong bullish expansion, pushing price directly into a major horizontal resistance line near 0.56490 while riding well above a rising short-term moving average line. Buyers are currently testing key breakout territory as price attempts to press higher into major multi-session peaks. 1. Core Price Action & Structure * Current Price: 0.56490 * Immediate Resistance Zone: 0.56490 – 0.56670 (Critical supply area matching recent high spikes and key overhead breakout level). * Immediate Support Zone: 0.56280 – 0.56085 (Dynamic support region provided by the upward-sloping short-term moving average line and prior consolidation structure). * Moving Average Dynamic: Price is holding firmly above its short-term moving average line, establishing strong upward trend alignment on the 1-hour timeframe. 2. Indicator Confluence * Relative Strength Index (RSI - 14): Currently sitting at 71.60. This places momentum in overbought territory above the 70 threshold, signaling powerful bullish control while warning of potential short-term exhaustion or a shallow pullback. * MACD (12, 26, 9): Positioned at 0.001044 / 0.000580 above the signal line with expanding positive histogram bars, confirming robust upside momentum. * Bears Power (13): Reads 0.001633, demonstrating complete buyer dominance over selling forces during current market hours. 3. Strategic Entry Scenarios Scenario A: Bullish Continuation (Long Entry) * Entry Trigger: A sustained 1-hour candle close above 0.56550 to confirm a resistance breakout, or a shallow dip-buy retest near 0.56280 at moving average support. * Stop Loss: 0.56085 (placed safely below immediate moving average support). * Take Profit Targets: * Target 1: 0.56670 * Target 2: 0.56900 Scenario B: Bearish Pullback (Short Entry) * Entry Trigger: A clear 1-hour rejection candle at resistance followed by a confirmed close back below 0.56280. * Stop Loss: 0.56580 (placed above recent peak high wicks). * Take Profit Targets: * Target 1: 0.56085 * Target 2: 0.55890 4. Executive Summary The NZD/USD 1-hour chart displays a decisive bullish trend as price rallies from recent consolidation lows near 0.55695 to challenge major horizontal resistance at 0.56490. Key technical indicators—including a positive MACD and a Bears Power reading of 0.001633—confirm strong buyer involvement. However, with the 14-period RSI reading 71.60 in overbought territory directly at horizontal resistance, entering market buy orders without confirmation carries risk. High-probability setups will depend on either a verified hourly candle close above 0.56550 or a disciplined pullback retest near 0.56280. Always adhere to proper risk management and target a minimum 1:2 risk-to-reward ratio on all trade executions.
*The market analysis posted here is meant to increase your awareness, but not to give instructions to make a trade
 Italiano
 Русский
 English
 Bahasa Indonesia
 Bahasa Malay
 ไทย
ไทย Español
 Deutsch
 Български
 Français
 Tiếng Việt
 中文
中文 বাংলা
বাংলা हिन्दी
 Čeština
 Українська
 Română
