 Gold (XAU/USD) M15 Technical Outlook Snapshot:
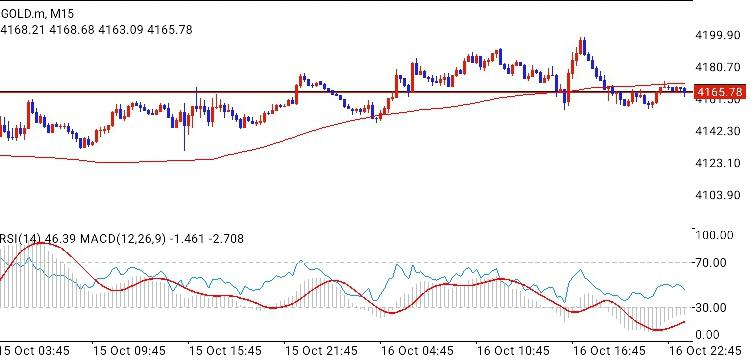
 Gold is trading near 4165.78 on the M15 chart, essentially at the flat horizontal level and the long moving average (red curve). It's Saturday, so this is the Friday close, and Monday's open may gap.
Market Structure Price rallied from the 4137-4140 zone on 15 Oct, with a clear higher-low sequence through the 16 Oct Asian and London sessions. That run peaked near 4199-4200 in a sharp, wick-heavy spike, followed by a quick rejection. Since then, price has drifted back down into the 4160s and is now compressing in a tight range around the horizontal line, which has acted as both support and resistance over the past two days.
Key Levels Resistance: 4172-4175 (MA and recent consolidation highs), then 4180, then the 4199-4200 spike high Support: 4160-4162 (recent swing lows), then 4142-4145, then the 4137 base
Momentum RSI (14) at 46.39 Neutral, slightly below 50. It has recovered from the oversold-adjacent dip but hasn't reclaimed the midline, so buyers lack conviction.
MACD (12,26,9) at -1.461 vs signal -2.708: The MACD line is above the signal line and the histogram is turning positive, a tentative bullish crossover. Both lines remain below zero, though, so this is a recovery within weak momentum, not a confirmed trend shift.
Scenarios Bullish: A sustained M15 close above 4172-4175 would put price back above the moving average and the horizontal level. That opens 4180 first, and a break there targets a retest of 4199. Confirmation would be RSI pushing above 50-55 and MACD crossing above zero.
Bearish: A close below 4160 would complete a lower-high structure after the 4200 rejection, with 4142-4145 as the next target. Below that, the whole 15 Oct rally is at risk of unwinding toward 4137. RSI falling below 40 would strengthen this case.
Base case: The compression suggests a breakout is coming. With the rejection at 4200 still fresh and momentum below the midline, the slight bias is neutral to mildly bearish until price reclaims the MA. The nearby moving average and horizontal level make this a decision zone, so false breaks are likely in thin liquidity.
Trading Considerations Wait for a candle close beyond 4160 or 4175 rather than anticipating the break, since the range is tight and wicks are large. Weekend news can gap price across these levels, so size positions accordingly if holding through the open. A stop beyond the opposite side of the range (roughly 8-10 points past entry on the M15) fits the recent volatility. Check higher timeframes (H1/H4) before committing, as M15 signals are noisy and the broader trend may override them. This is technical analysis of a single chart for informational purposes, not financial advice. I'm not a financial advisor, so manage risk according to your own plan.
*The market analysis posted here is meant to increase your awareness, but not to give instructions to make a trade
 Italiano
 Русский
 English
 Bahasa Indonesia
 Bahasa Malay
 ไทย
ไทย Español
 Deutsch
 Български
 Français
 Tiếng Việt
 中文
中文 বাংলা
বাংলা हिन्दी
 Čeština
 Українська
 Română
