 GBPUSD Daily Forecast
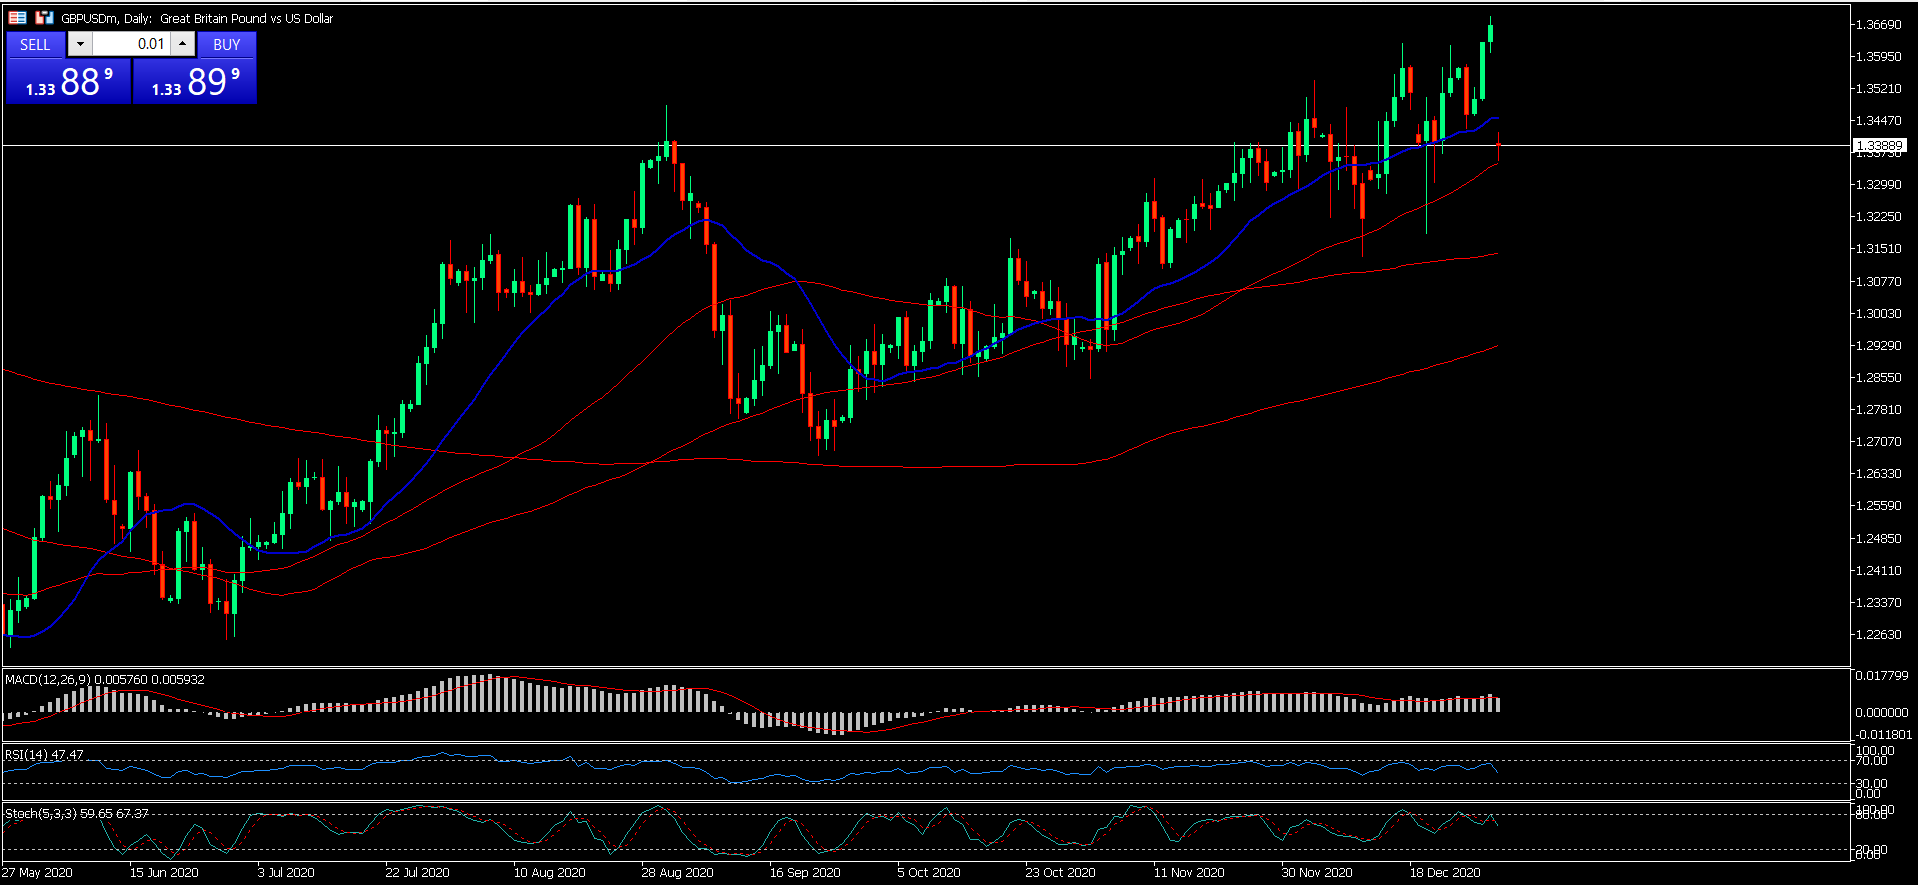
The British Pound drops 0.16% against the US Dollar to 1.3419, driven by increased unrest in the Middle East and US employment figures that point to an extremely healthy jobs market. This improves the possibility of interest rate hikes by the Federal Reserve; however, not until October. GBP/USD is trading at 1.3372. The rise in tensions between the US and Iran clouds most G7 FX majors, with Sterling included, due to the IRGC Navy warning against attacking US bases in case the US supports the transit of ships through the Strait of Hormuz. In addition to this, the news about preparation for another wave of strikes by the US and Israel following the US midterm elections further fuelled investors’ concerns about the prolonging of the war. Oil prices rose, with West Texas Intermediate (WTI) up 0.69% to $98.29 per barrel. Notably, US Treasury yields are falling sharply amid investors rushing into US Treasuries instead of equities. Initial Jobless Claims in the US for the week ending October 24 came in better than expected at 194K, beating estimates of 200K and a previous print of 199K. In addition, the four-week moving average of jobless claims fell to a near 57-year low of 197.75K, indicating a low-firing environment. The probability of Fed rate hikes in October is now virtually non-existent, at only 8%, but in December it is almost 80%, according to Prime Terminal. Recent data has increased the likelihood that the Bank of England may raise interest rates at the upcoming November 5 meeting after the release of higher-than-expected inflation figures for the week. In the coming days, investors will focus on the release of the Retail Sales and S&P Global Flash PMI readings, which may further reinforce expectations of an interest rate increase. Alongside this, investors will be watching the UK finance minister, John Healey, who will release his first budget on October 28. GBP/USD currently stands at 1.3379 on the daily chart and remains constrained, as it is below the crucial simple moving average cluster at 1.3407 and the downtrend line break at 1.3403. Although this is the structural condition, the relative strength index at 56 indicates improved upside momentum, implying that price action will need to test this resistance before any other recovery attempts can be made. Resistance is found immediately at 1.3403 based on the downtrend line, while the simple moving average cluster at 1.3407 acts as the resistance zone; a break through such a resistance level will make way for higher trend line resistances at 1.3624 and 1.3808. Below this level, immediate support will come from the former downtrend line at 1.3268, which will be tested if there is a breakout toward lower levels.
*The market analysis posted here is meant to increase your awareness, but not to give instructions to make a trade
 Italiano

 Русский
 English
 Bahasa Indonesia
 Bahasa Malay
 ไทย
 Español
 Deutsch
 Български
 Français
 Tiếng Việt
 中文
 বাংলা
 हिन्दी
 Čeština
 Українська
 Română

