 Market Structure & Multi-Session Price Action
A technical breakdown of the 1-hour chart for Crude Oil (#CL, H1) in
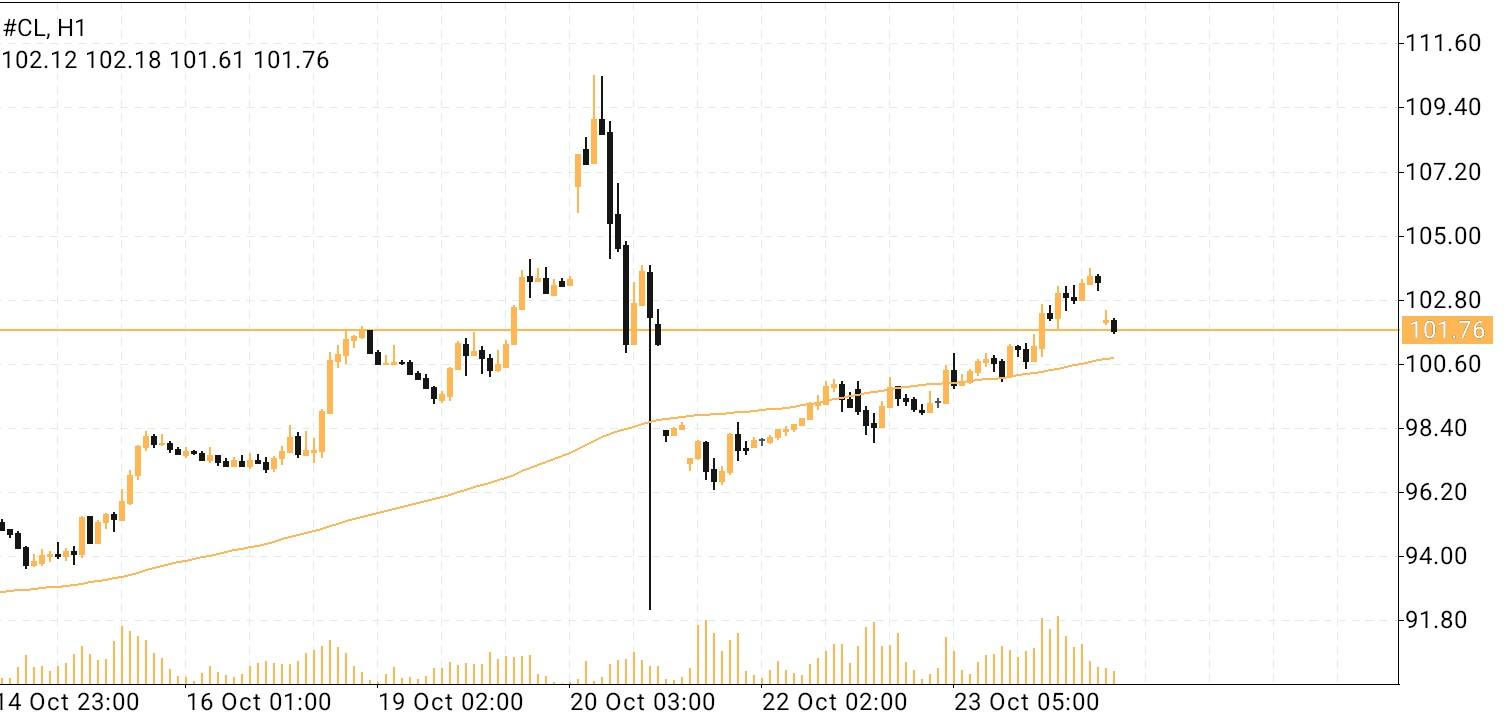
48340.png illustrates a volatile multi-session sequence featuring a powerful expansion to highs near 110.00 on October 20, followed by a violent flash drop to swing lows near 91.80 and a robust multi-stage recovery rally across October 21 through October 23. Buyers steadily rebuilt momentum following the flash crash, driving prices back up through intermediate resistance levels to challenge the primary horizontal pivot baseline.
Critical Levels & Horizontal Pivot Interaction The primary technical reference boundary on this H1 chart is defined by the orange horizontal line at
101.76:
Horizontal Pivot Baseline (101.76): This horizontal level acts as a critical structural axis, serving as major range support and resistance during prior sessions and currently functioning as immediate horizontal pivot resistance.
Current Intraday Price Compression: The latest 1-hour candle (OHLC: 102.12 open, 102.18 high, 101.61 low, 101.76 close) shows price probing to a high of 102.18 before pulling back to settle directly on
101.76. Closing precisely on this horizontal boundary indicates tight price compression as market participants evaluate breakout conviction versus rejection.
Dynamic Trend & Momentum Integration Integrating the technical indicators in
48340.png, the dynamic moving average illustrates a smooth, ascending trend curve across the H1 timeframe, rising steadily from the 94.00 region toward the
100.60 handle. Price action continues to hold cleanly above this rising dynamic curve, confirming that short-term momentum favors the buyers overall despite the latest minor retracement.
Forward Trading Scenarios & H1 Outlook As Crude Oil compresses directly on the
101.76 horizontal pivot baseline, 1-hour traders should monitor two primary technical scenarios:
Bullish Breakout & Trend Extension: A confirmed H1 candle hold and close back above
102.18 will signal a successful breakout through horizontal resistance. Securing this level enables buyers to extend the recovery toward overhead targets at 105.00, 107.20, and the multi-session peak near 110.00.
Bearish Rejection & Pullback: Conversely, if sellers defend the
101.76 baseline and force a decisive H1 close beneath
101.61, the breakout attempt will stall. A closing break below 101.61 opens the path for a corrective pullback toward lower support handles at 100.60 (coinciding with the ascending dynamic moving average), 98.40, and the swing low near 91.80.
Technical Summary: The #CL H1 chart in
48340.png demonstrates price compressing directly on key horizontal resistance at
101.76 following a robust recovery rally from the 91.80 flash low. Positioned cleanly above an ascending 1-hour moving average near 100.60, short-term structure remains constructive provided baseline support and momentum hold. A decisive H1 close above 102.18 enables buyers to target resistance at 105.00 and 110.00, whereas a closing break below 101.61 risks a corrective pullback toward support at 100.60 and 98.40.
*The market analysis posted here is meant to increase your awareness, but not to give instructions to make a trade
 Italiano

 Русский
 English
 Bahasa Indonesia
 Bahasa Malay
 ไทย
 Español
 Deutsch
 Български
 Français
 Tiếng Việt
 中文
 বাংলা
 हिन्दी
 Čeština
 Українська
 Română

