 Gold (XAU/USD) H1 Technical Outlook
Bias: bearish, with oversold conditions that favor a corrective bounce
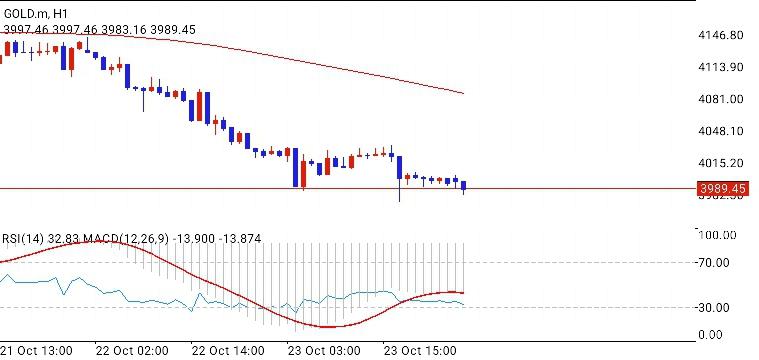
Market Structure Gold is in a clear hourly downtrend. Since the swing high near 4,146 on 21–22 October, price has made a steady series of lower highs and lower lows, falling about 150 points to 3,989.45. The sell-off came in two legs: a sharp drop through 22 October, then a pause around 4,015–4,030 on 23 October that failed to produce a real recovery. A bearish engulfing candle during the 23 October 15:00 session broke that range and sent price back to the lows.
Moving Average The long-term red moving average is sloping downward and sits near 4,090, about 100 points above price. Price has stayed below it throughout this decline. That confirms sellers control the trend, and any rally into that zone is more likely to be sold than to start a reversal.
Momentum RSI(14) at 32.83. is just above the 30 oversold line. Selling pressure is heavy, but the reading shows no bullish divergence yet, so it is not a buy signal on its own.
MACD (12,26,9) is at -13.900 against a signal of -13.874. Both are below zero, which keeps momentum bearish. However, the MACD line has curved upward from its trough around 23 October 03:00, and the histogram bars have shrunk. Downside momentum is fading, which hints at consolidation or a pullback rather than an immediate continuation.
Key Levels Type | Level | | Resistance 1 | 4,015–4,030 (broken range) | Resistance 2 | 4,048 | Resistance 3 | 4,090 (MA) / 4,113 | Support 1 | 3,983 | Support 2 | 3,960–3,970 (wick low) | The long lower wick on 23 October shows buyers defended the area below 3,983, but the small-bodied candles since then show weak follow-through.
Scenarios Bearish (primary):If price stays under 4,015 and breaks below 3,983 on an H1 close, expect a move toward 3,960–3,970, with extension lower if that fails. Sellers would likely target the failed bounce area as resistance. Corrective bounce (alternative): With RSI near oversold and MACD flattening, a relief rally toward 4,015–4,030 is plausible. A sustained break above 4,030 would be the first sign the trend is weakening. Even then, the 4,048–4,090 zone is a heavy ceiling.
Trading Considerations Selling rallies into 4,015–4,030 with stops above 4,050 fits the prevailing trend. Chasing shorts at current levels carries poor risk-to-reward, since price is sitting right on support with RSI stretched. Wait for a confirmed H1 close below 3,983, or a rejection candle at resistance, before committing.
Caveat: This chart ends at the 23 October session, and today is Monday 26 October. Check the current price and any weekend gap before acting on these levels. Gold also reacts strongly to US dollar moves, yields and central-bank news, which can override technical setups. This is analysis, not financial advice.
*The market analysis posted here is meant to increase your awareness, but not to give instructions to make a trade
 Italiano

 Русский
 English
 Bahasa Indonesia
 Bahasa Malay
 ไทย
 Español
 Deutsch
 Български
 Français
 Tiếng Việt
 中文
 বাংলা
 हिन्दी
 Čeština
 Українська
 Română

