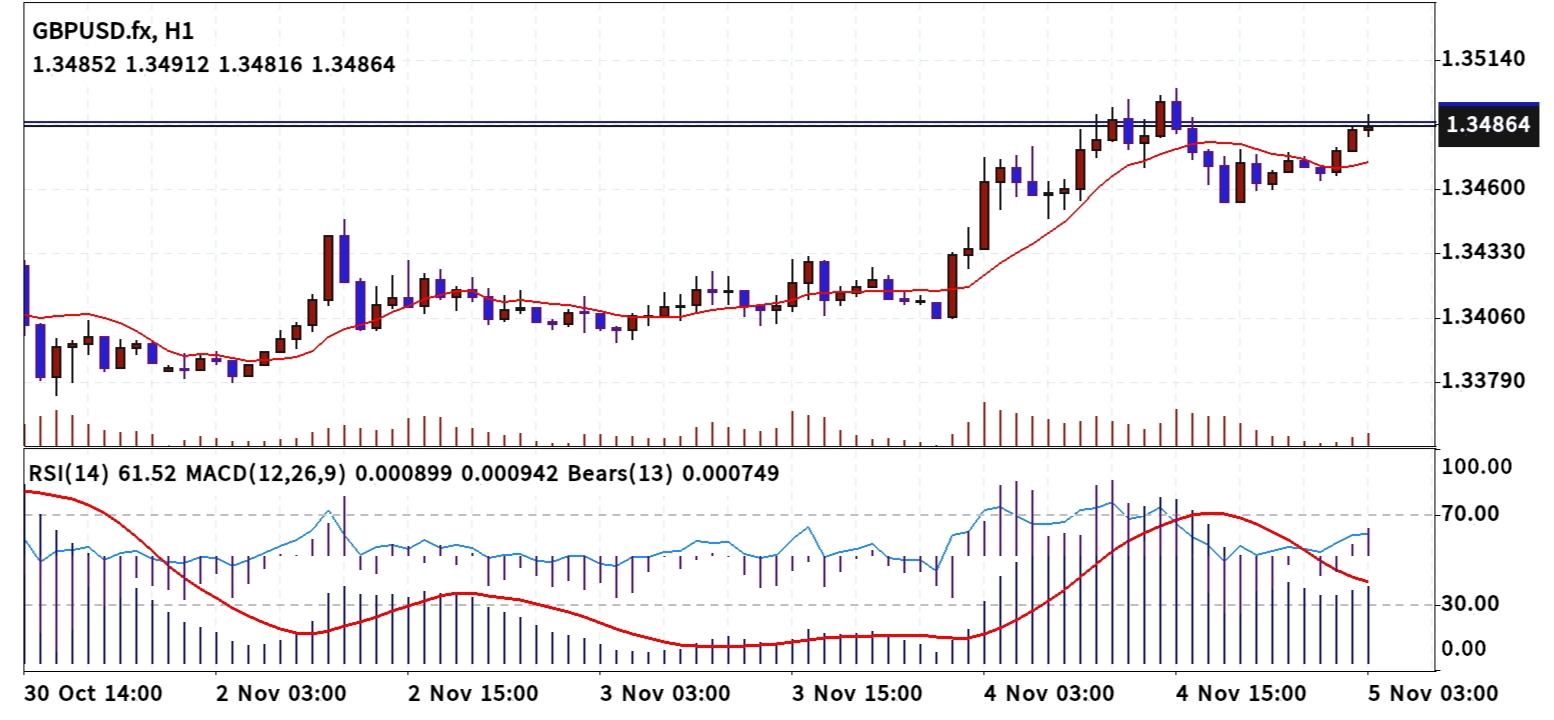
 GBP/USD Technical Analysis H-1 Chart
MARKET TREND GBPUSD lifted off a base above 1.33790, stalled, and then spent 2 and 3 November in a flat band around 1.34060 to 1.34330, with the red average going nowhere. The 4 November push changed that. Price drove through 1.34330 and 1.34600 and ran into a horizontal line near the top of the chart. The pullback held above 1.34600, and the average only flattened. The latest candles have turned back up into that same line. This hour is open 1.34852, high 1.34912, low 1.34816, close 1.34864. The swing is still a series of higher lows. SUPPORT AND RESISTANCE The active ceiling is the horizontal line just above the 1.34864 close. The bar high of 1.34912 is the probe into it. 1.35140, the next label above the line, has not been traded. Under price, 1.34600 is the first marked level, and the pullback after the spike stayed above it. 1.34330 was the top of the prior range and the area the breakout left. BREAKOUT ANALYSIS The range break was accepted: price closed through 1.34600 and did not fall back, and volume was taller on the launch than in the chop. The ceiling is a different test. Wicks have already pushed through the line and failed to stay there, and this hour's 1.34912 high is another probe without a close past it. RSI(14) is 61.52. MACD at 0.000899 is just under the 0.000942 signal, so the thrust has cooled. Bears Power at 0.000749 keeps price above the short average. Acceptance would be an hourly close above 1.34912 that holds and pulls MACD back over the signal. Rejection would be another failed poke and a close under 1.34600. TRADING PLAN A long is cleaner after an hourly close above 1.34912 than at 1.34864, still under the line. The marked target is 1.35140, and the idea fails on a close back under 1.34600. A short needs that loss of 1.34600 after a failed test of 1.34912, which would open 1.34330, and it is invalid above 1.34912. RISK MANAGEMENT Up to 1.35140 from 1.34864 is about the same distance as down to 1.34600, so that stop barely pays and size has to come from it. A stop under 1.34816 is tighter, and this hour has already traded there. Pass if the payoff is thin. No reading removes the chance that the push into the line fails. CONCLUSION AND ENGAGEMENT QUESTION GBPUSD H1 has a real break through 1.34600, a pullback that held, and a fresh test of the highs, with RSI at 61.52 and MACD still just under its signal. Do you need a close above 1.34912, or is holding 1.34600 enough to stay long into the line?
*The market analysis posted here is meant to increase your awareness, but not to give instructions to make a trade
 Italiano

 Русский
 English
 Bahasa Indonesia
 Bahasa Malay
 ไทย
 Español
 Deutsch
 Български
 Français
 Tiếng Việt
 中文
 বাংলা
 हिन्दी
 Čeština
 Українська
 Română

