logo

FX.co ★ king.zelda | XAU/USD, GOLD

XAU/USD, GOLD

Technical Analysis: GOLD (Timeframe W1)

XAU/USD, GOLD

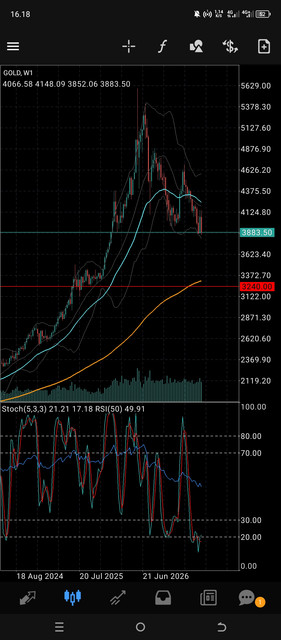
This observation highlights the gold commodity instrument—GOLD on the weekly timeframe (W1). Looking at the array of candlestick over that period, the price movement of gold displays an impressive long run before finally entering a fairly noticeable correction phase. 1. Price Movement Snapshot & Chart Anatomy After rising high and printing a swing high peak above the 5100 to 5300 range, selling pressure gradually took control and pushed the price down. A series of red candlestick appeared alternately cutting lower levels, until the price is now around 3883.50, close to the lower band of the weekly Bollinger Bands. The orange Moving Average line is still curved upward far below the current price action, indicating that on a macro or very long-term scale, the main bullish trend foundation is not yet completely broken despite the ongoing medium-term correction. 2. Oscillator Review & Volume Activity Observing the volume histogram at the bottom, transaction participation appears fairly consistent and stable throughout this down phase, suggesting measured hand-offs and position distribution in the market. On the Stochastic (5,3,3) panel, both lines are around 21.21 and 17.18, indicating short-term momentum has reached the oversold area (oversold). Meanwhile, the RSI(50) indicator sits right at 49.91, nearly touching the neutral midline. The RSI positioned at equilibrium while the Stochastic begins to dive into the lower zone shows a tug-of-war between corrective pressure and attempts to stabilize price in the lower area. 3. Execution Strategy & Risk Control Lower Area Reaction Monitoring Option: Because the price is touching the lower band of the weekly Bollinger Bands and the Stochastic indicator is approaching the oversold zone, a prudent step is to observe whether signs of price rejection (rejection) or the formation of a reversal candlestick appear before considering a Buy on Dip scenario. Beware of Continued Correction: If selling pressure continues and convincingly breaks the lower band, the price could test a dynamic support area or a lower Moving Average line. Capital Protection Discipline: On the weekly timeframe (weekly), the price range per single candle can be very wide so its fluctuations require high precision. Ensure position size is always proportional to account resilience and place Stop Loss in a measured way so capital remains protected from unexpected market turmoil.
*The market analysis posted here is meant to increase your awareness, but not to give instructions to make a trade
Go to the articles list Read this post on the forum Open trading account