 Technical and Fundamental Analysis of the GBP/JPY Pair
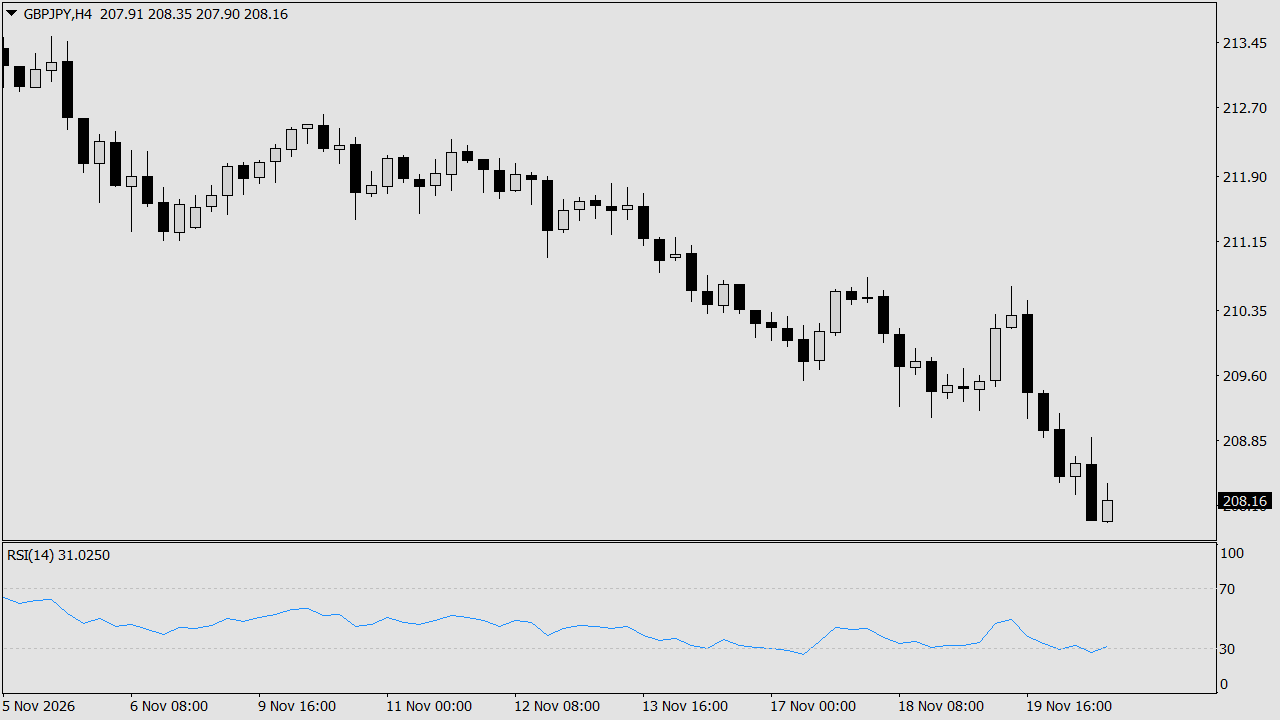
GBP/JPY remains under pressure near 208.15 as growing expectations of tighter monetary policy in Japan contrast with an increasingly cautious outlook for the UK economy. The Japanese yen has gained support from rising inflation and speculation that the Bank of Japan could deliver another interest-rate increase in December. Japan's October core consumer price inflation accelerated to 2.2% year over year from 2.1% in September, remaining above the BOJ's 2% target for a second consecutive month. The latest figures have strengthened expectations that the central bank could raise its policy rate from 1.25% to 1.50% at its December 17–18 meeting. A Reuters poll published on November 19 found that 86% of economists expected such a move, highlighting the growing conviction that Japan's monetary-policy normalization will continue. The outlook for sterling is more complicated. The Bank of England raised its benchmark interest rate by 25 basis points to 4.00% at its November 4 meeting, with eight policymakers voting for the increase and one favoring a larger 50-basis-point move. The decision reflected concerns that higher energy prices could push UK inflation toward 5% by the middle of 2027. However, the central bank also warned that economic growth could slow as elevated energy costs reduce household purchasing power and tighter financial conditions weigh on demand. The combination of persistent inflation and weaker growth creates uncertainty over the pace of further BoE tightening, limiting the pound's ability to attract sustained buying interest. Recent UK economic figures have offered some support for sterling, although they have not been enough to reverse the broader pressure on GBP/JPY. UK GDP expanded by 0.7% in the third quarter of 2026, following growth of 0.5% in the previous quarter. Services output was the main contributor, increasing by 0.9%, while construction activity declined by 0.7%. Investors are also monitoring the latest Japanese inflation data and upcoming UK retail-sales figures for further clues about the relative strength of the two economies. With the BOJ potentially moving toward higher rates while the UK faces a more uncertain growth outlook, the monetary-policy divergence could become less favorable for GBP/JPY. GBP/JPY is trading near 208.15 and maintains a clear bearish structure on the H4 timeframe. Price remains well below both the 20-period and 50-period simple moving averages, which are sloping lower and acting as dynamic resistance overhead. The H4 20 SMA is positioned in the mid-209 area, while the 50 SMA is higher near 210.00. This downward alignment confirms that sellers remain in control of the intermediate-term trend and that recovery attempts continue to face significant technical obstacles. A major H4 supply zone is concentrated between 209.50 and 210.50, where previous selling pressure originated and the two moving averages create a layered resistance area. Any corrective rebound into this region could attract fresh selling interest, particularly if bearish rejection candles emerge. Further overhead, the 211.00–211.80 region represents a stronger supply cluster associated with recent swing highs. A sustained recovery above the nearer resistance band would be necessary before traders could begin considering a broader reversal, while failure to reclaim the descending moving averages would preserve the prevailing downside bias. On the demand side, H4 buyers have shown interest around 208.00–207.70, an area aligned with recent session lows and previous consolidation bases. This is the first important support region to monitor as the pair trades close to the lower end of its recent range. A sustained hold could allow a temporary corrective rebound, although buyers would still need to overcome the overhead moving averages and supply zones to change the broader structure. A decisive H4 close below 207.70 would expose the next downside region between 207.00 and 206.50, potentially accelerating the bearish move. The H1 timeframe reinforces the negative outlook. Price is trading below the 20 SMA near 208.70–209.00 and the 50 SMA around 209.30–209.50, with the faster average acting as immediate dynamic resistance during intraday rallies. H1 supply is visible between 208.80 and 209.40, supported by the 20 SMA and a sequence of lower highs. A secondary resistance pocket sits around 209.80–210.20. Immediate H1 demand lies between 208.00 and 207.80, overlapping with the broader H4 support region and the current session's lower trading range. For the immediate outlook, the alignment of price below both moving averages on H4 and H1 keeps the bias tilted to the downside. Rejections from 208.80–209.40 or the broader 209.50–210.50 supply zone could provide confirmation of renewed selling pressure, while a sustained break below 207.70 would open the way toward 207.00–206.50. Conversely, a sustained recovery above the 20 SMA and the 209.50–210.00 resistance area would begin to challenge the bearish structure.
*The market analysis posted here is meant to increase your awareness, but not to give instructions to make a trade
 Italiano

 Русский
 English
 Bahasa Indonesia
 Bahasa Malay
 ไทย
 Español
 Deutsch
 Български
 Français
 Tiếng Việt
 中文
 বাংলা
 हिन्दी
 Čeština
 Українська
 Română

