 Română
  Русский
 English
 Bahasa Indonesia
 Bahasa Malay
 ไทย
ไทย Español
 Deutsch
 Български
 Français
 Tiếng Việt
 中文
中文 বাংলা
বাংলা हिन्दी
 Čeština
 Українська
FX.co ★ Patterns #AAPL | Apple Inc. Stock Price


#AAPL M5
Double Top
The Double Top pattern has been formed on #AAPL M5. It signals that the trend has been changed from upwards to downwards. Probably, if the base of the pattern 322.20 is broken, the downward movement will continue.

#AAPL M5
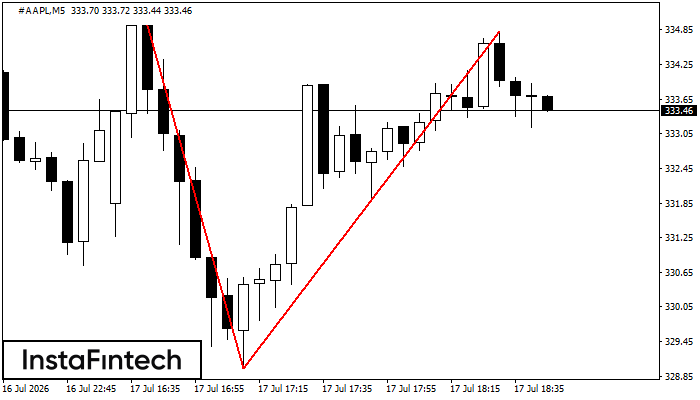
Triple Bottom
The Triple Bottom pattern has formed on the chart of #AAPL M5. Features of the pattern: The lower line of the pattern has coordinates 326.52 with the upper limit 326.52/325.13, the projection of the width is 213 points. The formation of the Triple Bottom pattern most likely indicates a change in the trend from downward to upward. This means that in the event of a breakdown of the resistance level 324.39, the price is most likely to continue the upward movement.

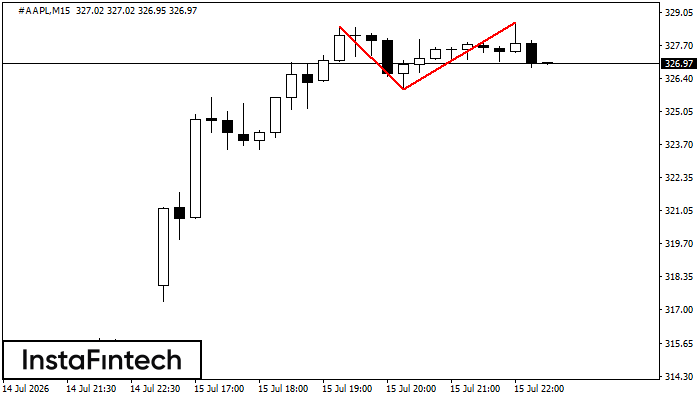
#AAPL M15
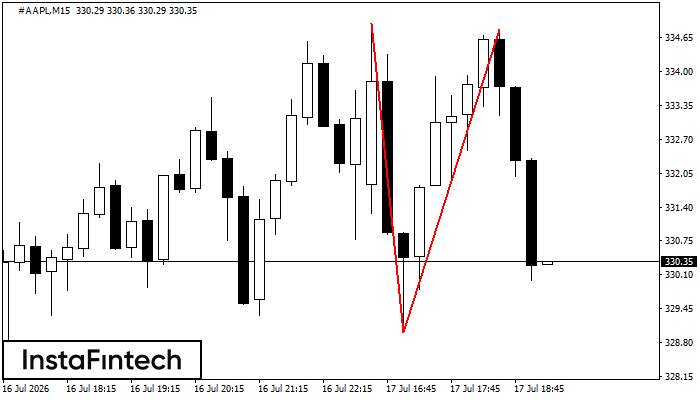
Bearish pennant
The Bearish pennant pattern has formed on the #AAPL M15 chart. The pattern signals continuation of the downtrend in case the pennant’s low of 325.56 is broken through. Recommendations: Place the sell stop pending order 10 pips below the pattern’s low. Place the take profit order at the projection distance of the flagpole height.

#AAPL M30
Double Top
The Double Top reversal pattern has been formed on #AAPL M30. Characteristics: the upper boundary 334.93; the lower boundary 328.99; the width of the pattern is 563 points. Sell trades are better to be opened below the lower boundary 328.99 with a possible movements towards the 328.69 level.
#AAPL M5
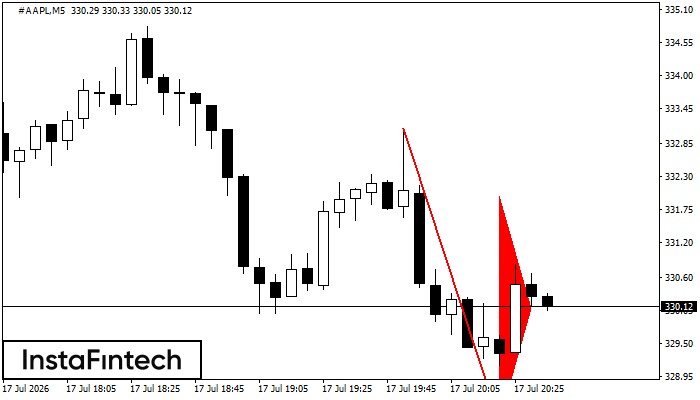
Bearish Flag
The Bearish Flag pattern has been formed on #AAPL at M5. The lower boundary of the pattern is located at 328.17/330.51 while the upper boundary lies at 330.47/332.81. The projection of the flagpole is 494 points. This formation signals that the downward trend is most likely to continue. Therefore, if the level of 328.17 is broken, the price will move further downwards.
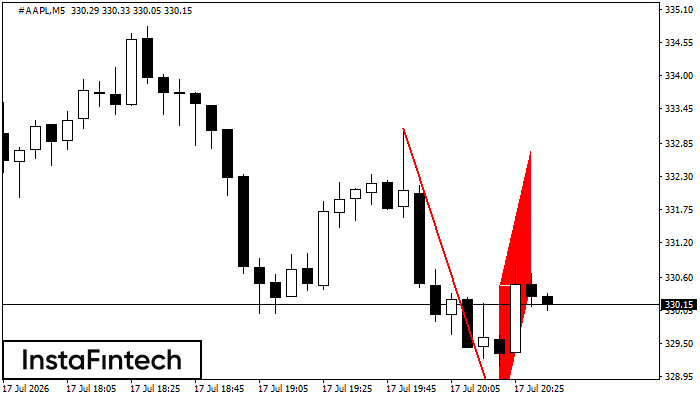
#AAPL M5
Bearish pennant
The Bearish pennant pattern has formed on the #AAPL M5 chart. The pattern signals continuation of the downtrend in case the pennant’s low of 328.17 is broken through. Recommendations: Place the sell stop pending order 10 pips below the pattern’s low. Place the take profit order at the projection distance of the flagpole height.
#AAPL M15
Double Top
The Double Top pattern has been formed on #AAPL M15. It signals that the trend has been changed from upwards to downwards. Probably, if the base of the pattern 328.99 is broken, the downward movement will continue.
#AAPL M5
Double Top
The Double Top pattern has been formed on #AAPL M5. It signals that the trend has been changed from upwards to downwards. Probably, if the base of the pattern 328.99 is broken, the downward movement will continue.
#AAPL M15
Double Top
On the chart of #AAPL M15 the Double Top reversal pattern has been formed. Characteristics: the upper boundary 328.67; the lower boundary 325.95; the width of the pattern 272 points. The signal: a break of the lower boundary will cause continuation of the downward trend targeting the 325.73 level.
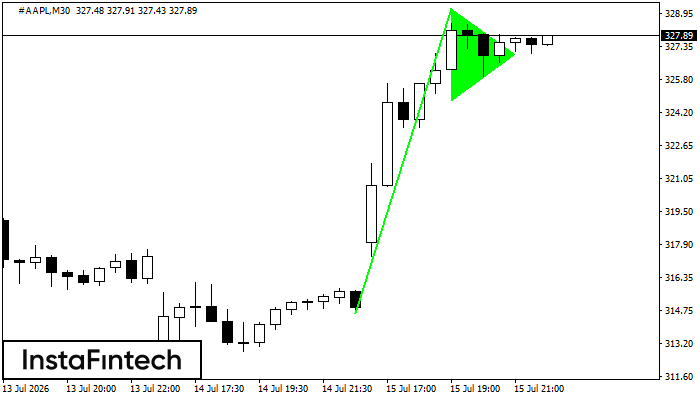
#AAPL M30
Bullish pennant
The Bullish pennant graphic pattern has formed on the #AAPL M30 instrument. This pattern type falls under the category of continuation patterns. In this case, if the quote can breaks out high, is expected to continue the upward trend to level 329.49.