 Română
  Русский
 English
 Bahasa Indonesia
 Bahasa Malay
 ไทย
ไทย Español
 Deutsch
 Български
 Français
 Tiếng Việt
 中文
中文 বাংলা
বাংলা हिन्दी
 Čeština
 Українська
FX.co ★ Patterns AUDCAD | Australian Dollar (AUD) to Canadian Dollar (CAD) Rate in the Forex market


AUDCAD M30
Double Top
The Double Top reversal pattern has been formed on AUDCAD M30. Characteristics: the upper boundary 0.9876; the lower boundary 0.9860; the width of the pattern is 16 points. Sell trades are better to be opened below the lower boundary 0.9860 with a possible movements towards the 0.9830 level.

AUDCAD M15
Double Top
On the chart of AUDCAD M15 the Double Top reversal pattern has been formed. Characteristics: the upper boundary 0.9876; the lower boundary 0.9860; the width of the pattern 16 points. The signal: a break of the lower boundary will cause continuation of the downward trend targeting the 0.9837 level.

AUDCAD M5
Double Top
The Double Top pattern has been formed on AUDCAD M5. It signals that the trend has been changed from upwards to downwards. Probably, if the base of the pattern 0.9857 is broken, the downward movement will continue.

AUDCAD M15
Triple Top
The Triple Top pattern has formed on the chart of the AUDCAD M15. Features of the pattern: borders have an ascending angle; the lower line of the pattern has the coordinates 0.9833/0.9837 with the upper limit 0.9845/0.9845; the projection of the width is 12 points. The formation of the Triple Top figure most likely indicates a change in the trend from upward to downward. This means that in the event of a breakdown of the support level of 0.9833, the price is most likely to continue the downward movement.

AUDCAD M15
Double Top
The Double Top reversal pattern has been formed on AUDCAD M15. Characteristics: the upper boundary 0.9845; the lower boundary 0.9833; the width of the pattern is 12 points. Sell trades are better to be opened below the lower boundary 0.9833 with a possible movements towards the 0.9811 level.

AUDCAD M5
Bullish Rectangle
According to the chart of M5, AUDCAD formed the Bullish Rectangle. The pattern indicates a trend continuation. The upper border is 0.9785, the lower border is 0.9777. The signal means that a long position should be opened above the upper border 0.9785 of the Bullish Rectangle.
AUDCAD M30
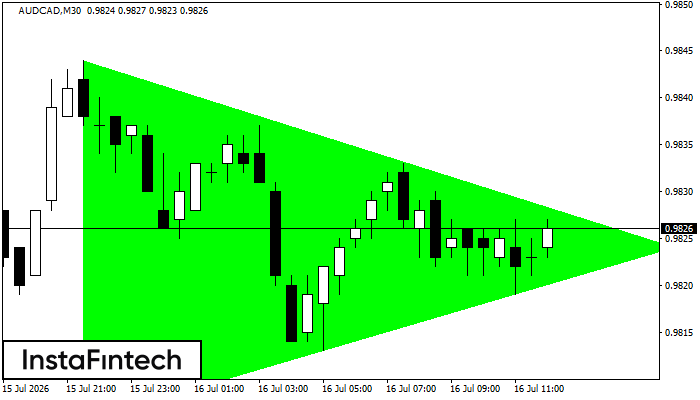
Bullish Symmetrical Triangle
According to the chart of M30, AUDCAD formed the Bullish Symmetrical Triangle pattern, which signals the trend will continue. Description. The upper border of the pattern touches the coordinates 0.9844/0.9824 whereas the lower border goes across 0.9806/0.9824. The pattern width is measured on the chart at 38 pips. If the Bullish Symmetrical Triangle pattern is in progress during the upward trend, this indicates the current trend will go on. In case 0.9824 is broken, the price could continue its move toward 0.9854.
AUDCAD M5
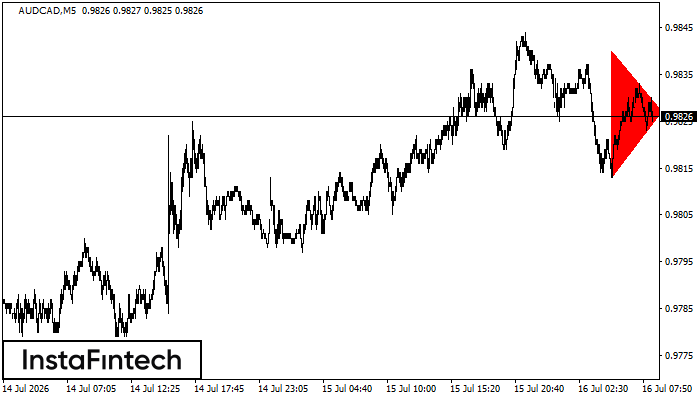
Bearish Symmetrical Triangle
According to the chart of M5, AUDCAD formed the Bearish Symmetrical Triangle pattern. Description: The lower border is 0.9813/0.9827 and upper border is 0.9840/0.9827. The pattern width is measured on the chart at -27 pips. The formation of the Bearish Symmetrical Triangle pattern evidently signals a continuation of the downward trend. In other words, if the scenario comes true and AUDCAD breaches the lower border, the price could continue its move toward 0.9812.
AUDCAD M30
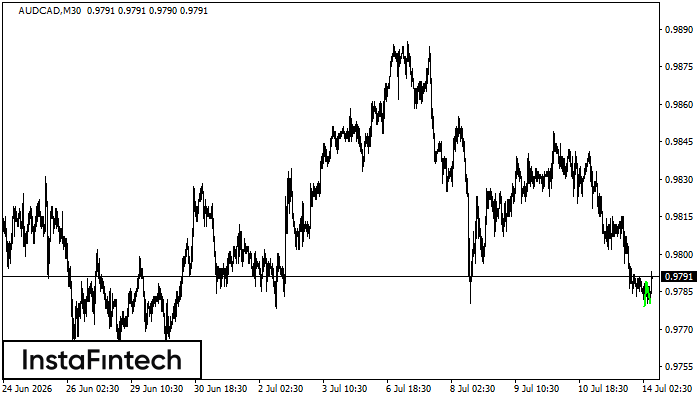
Double Bottom
The Double Bottom pattern has been formed on AUDCAD M30. Characteristics: the support level 0.9779; the resistance level 0.9789; the width of the pattern 10 points. If the resistance level is broken, a change in the trend can be predicted with the first target point lying at the distance of 9 points.
AUDCAD M15
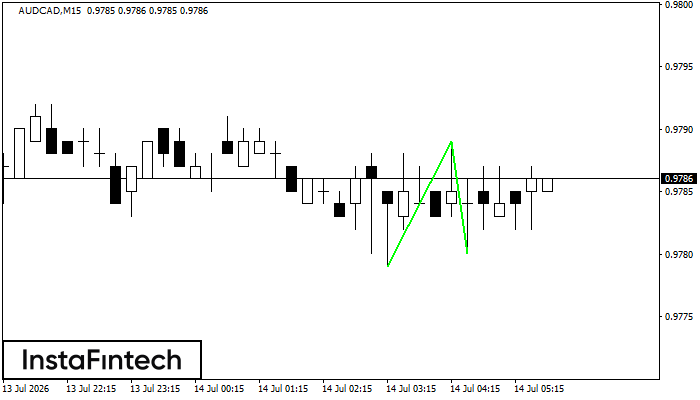
Double Bottom
The Double Bottom pattern has been formed on AUDCAD M15. Characteristics: the support level 0.9779; the resistance level 0.9789; the width of the pattern 10 points. If the resistance level is broken, a change in the trend can be predicted with the first target point lying at the distance of 9 points.