 Română
  Русский
 English
 Bahasa Indonesia
 Bahasa Malay
 ไทย
ไทย Español
 Deutsch
 Български
 Français
 Tiếng Việt
 中文
中文 বাংলা
বাংলা हिन्दी
 Čeština
 Українська
FX.co ★ Patterns AUDUSD | Australian Dollar (AUD) to US Dollar (USD) Rate in the Forex market


AUDUSD M5
Double Bottom
The Double Bottom pattern has been formed on AUDUSD M5; the upper boundary is 0.7013; the lower boundary is 0.7003. The width of the pattern is 10 points. In case of a break of the upper boundary 0.7013, a change in the trend can be predicted where the width of the pattern will coincide with the distance to a possible take profit level.

AUDUSD M5
Head and Shoulders
The technical pattern called Head and Shoulders has appeared on the chart of AUDUSD M5. There are weighty reasons to suggest that the price will surpass the Neckline 0.7004/0.7005 after the right shoulder has been formed. So, the trend is set to change with the price heading for 0.6990.

AUDUSD M5
Bearish Rectangle
According to the chart of M5, AUDUSD formed the Bearish Rectangle. This type of a pattern indicates a trend continuation. It consists of two levels: resistance 0.7002 - 0.0000 and support 0.6994 – 0.6994. In case the resistance level 0.6994 - 0.6994 is broken, the instrument is likely to follow the bearish trend.

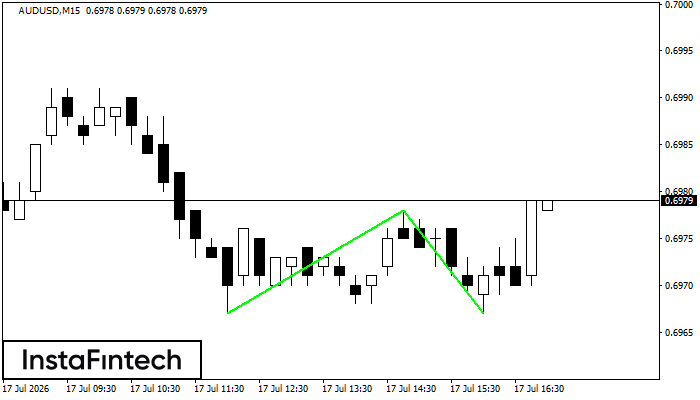
AUDUSD M15
Double Top
The Double Top pattern has been formed on AUDUSD M15. It signals that the trend has been changed from upwards to downwards. Probably, if the base of the pattern 0.7002 is broken, the downward movement will continue.

AUDUSD M5
Bullish pennant
The Bullish pennant signal – Trading instrument AUDUSD M5, continuation pattern. Forecast: it is possible to set up a buy position above the pattern’s high of 0.7016, with the prospect of the next move being a projection of the flagpole height.

AUDUSD M5
Bullish Flag
The Bullish Flag pattern has been formed on AUDUSD at M5. The lower boundary of the pattern is located at 0.6994/0.6994, while the higher boundary lies at 0.6994/0.6994. The projection of the flagpole is 4 points. This formation signals that the upward trend is most likely to continue. Therefore, if the level of 0.6994 is broken, the price will move further upwards.

AUDUSD M5
Bearish pennant
The Bearish pennant pattern has formed on the AUDUSD M5 chart. The pattern signals continuation of the downtrend in case the pennant’s low of 0.6961 is broken through. Recommendations: Place the sell stop pending order 10 pips below the pattern’s low. Place the take profit order at the projection distance of the flagpole height.

AUDUSD M5
Bullish Rectangle
According to the chart of M5, AUDUSD formed the Bullish Rectangle. The pattern indicates a trend continuation. The upper border is 0.6986, the lower border is 0.6979. The signal means that a long position should be opened above the upper border 0.6986 of the Bullish Rectangle.

AUDUSD M5
Bullish Symmetrical Triangle
According to the chart of M5, AUDUSD formed the Bullish Symmetrical Triangle pattern, which signals the trend will continue. Description. The upper border of the pattern touches the coordinates 0.6986/0.6982 whereas the lower border goes across 0.6979/0.6982. The pattern width is measured on the chart at 7 pips. If the Bullish Symmetrical Triangle pattern is in progress during the upward trend, this indicates the current trend will go on. In case 0.6982 is broken, the price could continue its move toward 0.6997.
AUDUSD M15
Double Bottom
The Double Bottom pattern has been formed on AUDUSD M15. Characteristics: the support level 0.6967; the resistance level 0.6978; the width of the pattern 11 points. If the resistance level is broken, a change in the trend can be predicted with the first target point lying at the distance of 11 points.