 Română
  Русский
 English
 Bahasa Indonesia
 Bahasa Malay
 ไทย
ไทย Español
 Deutsch
 Български
 Français
 Tiếng Việt
 中文
中文 বাংলা
বাংলা हिन्दी
 Čeština
 Українська
FX.co ★ Patterns #EBAY | eBay Inc. Stock Price


#EBAY M5
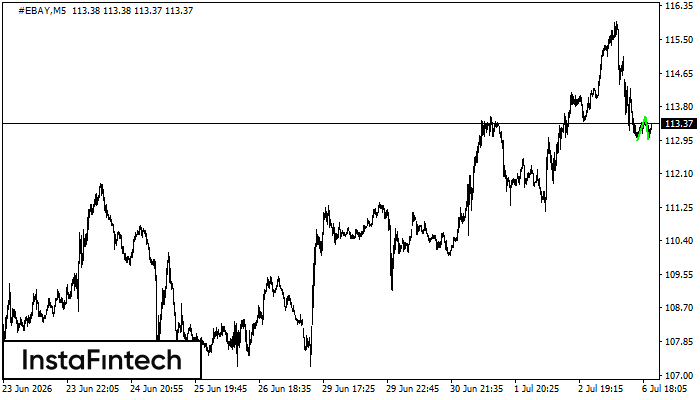
Bearish pennant
The Bearish pennant pattern has formed on the #EBAY M5 chart. This pattern type is characterized by a slight slowdown after which the price will move in the direction of the original trend. In case the price fixes below the pattern’s low of 112.57, a trader will be able to successfully enter the sell position.

#EBAY M30
Bullish pennant
The Bullish pennant pattern is formed on the #EBAY M30 chart. It is a type of the continuation pattern. Supposedly, in case the price is fixed above the pennant’s high of 114.55, a further uptrend is possible.

#EBAY M5
Double Top
The Double Top reversal pattern has been formed on #EBAY M5. Characteristics: the upper boundary 112.17; the lower boundary 111.29; the width of the pattern is 83 points. Sell trades are better to be opened below the lower boundary 111.29 with a possible movements towards the 111.14 level.

#EBAY M5
Triple Bottom
The Triple Bottom pattern has been formed on #EBAY M5. It has the following characteristics: resistance level 113.20/113.06; support level 112.56/112.66; the width is 64 points. In the event of a breakdown of the resistance level of 113.20, the price is likely to continue an upward movement at least to 112.82.

#EBAY M15
Bearish pennant
The Bearish pennant pattern has formed on the #EBAY M15 chart. The pattern signals continuation of the downtrend in case the pennant’s low of 112.06 is broken through. Recommendations: Place the sell stop pending order 10 pips below the pattern’s low. Place the take profit order at the projection distance of the flagpole height.

#EBAY M5
Triple Bottom
The Triple Bottom pattern has formed on the chart of #EBAY M5. Features of the pattern: The lower line of the pattern has coordinates 116.54 with the upper limit 116.54/116.30, the projection of the width is 42 points. The formation of the Triple Bottom pattern most likely indicates a change in the trend from downward to upward. This means that in the event of a breakdown of the resistance level 116.12, the price is most likely to continue the upward movement.

#EBAY H1
Double Top
The Double Top pattern has been formed on #EBAY H1. It signals that the trend has been changed from upwards to downwards. Probably, if the base of the pattern 116.47 is broken, the downward movement will continue.

#EBAY M30
Double Top
On the chart of #EBAY M30 the Double Top reversal pattern has been formed. Characteristics: the upper boundary 117.92; the lower boundary 116.47; the width of the pattern 145 points. The signal: a break of the lower boundary will cause continuation of the downward trend targeting the 116.17 level.
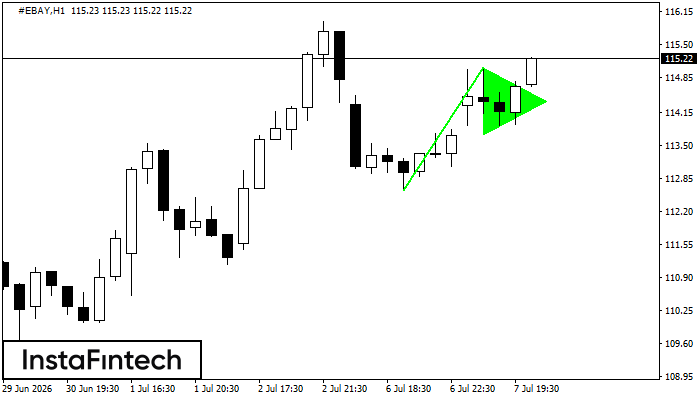
#EBAY H1
Bullish pennant
The Bullish pennant graphic pattern has formed on the #EBAY H1 instrument. This pattern type falls under the category of continuation patterns. In this case, if the quote can breaks out high, is expected to continue the upward trend to level 115.44.
#EBAY M5
Double Bottom
The Double Bottom pattern has been formed on #EBAY M5. This formation signals a reversal of the trend from downwards to upwards. The signal is that a buy trade should be opened after the upper boundary of the pattern 113.55 is broken. The further movements will rely on the width of the current pattern 60 points.