 Română
  Русский
 English
 Bahasa Indonesia
 Bahasa Malay
 ไทย
ไทย Español
 Deutsch
 Български
 Français
 Tiếng Việt
 中文
中文 বাংলা
বাংলা हिन्दी
 Čeština
 Українська
FX.co ★ Patterns EURJPY | Euro (EUR) to Japanese Yen (JPY) Rate in the Forex market


EURJPY M5
Double Bottom
The Double Bottom pattern has been formed on EURJPY M5; the upper boundary is 185.64; the lower boundary is 185.59. The width of the pattern is 5 points. In case of a break of the upper boundary 185.64, a change in the trend can be predicted where the width of the pattern will coincide with the distance to a possible take profit level.

EURJPY M5
Bearish pennant
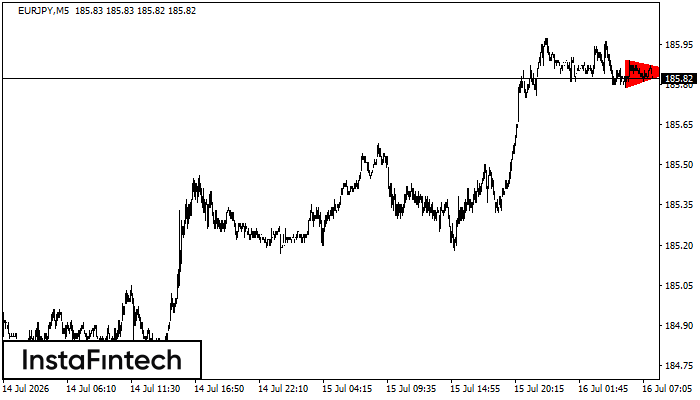
The Bearish pennant pattern has formed on the EURJPY M5 chart. The pattern signals continuation of the downtrend in case the pennant’s low of 185.59 is broken through. Recommendations: Place the sell stop pending order 10 pips below the pattern’s low. Place the take profit order at the projection distance of the flagpole height.

EURJPY M30
Bearish Symmetrical Triangle
According to the chart of M30, EURJPY formed the Bearish Symmetrical Triangle pattern. Description: The lower border is 185.45/185.71 and upper border is 185.92/185.71. The pattern width is measured on the chart at -47 pips. The formation of the Bearish Symmetrical Triangle pattern evidently signals a continuation of the downward trend. In other words, if the scenario comes true and EURJPY breaches the lower border, the price could continue its move toward 185.41.
EURJPY M30
Bullish Rectangle
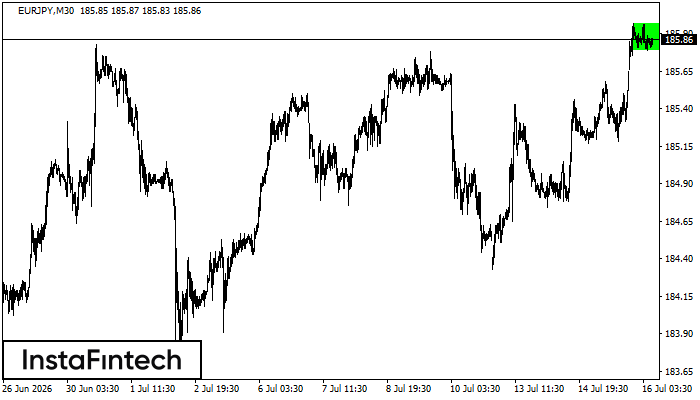
According to the chart of M30, EURJPY formed the Bullish Rectangle which is a pattern of a trend continuation. The pattern is contained within the following borders: the lower border 185.79 – 185.79 and upper border 185.97 – 185.97. In case the upper border is broken, the instrument is likely to follow the upward trend.
EURJPY M5
Bearish Symmetrical Triangle
According to the chart of M5, EURJPY formed the Bearish Symmetrical Triangle pattern. This pattern signals a further downward trend in case the lower border 185.79 is breached. Here, a hypothetical profit will equal the width of the available pattern that is -10 pips.
EURJPY M15
Bullish Rectangle
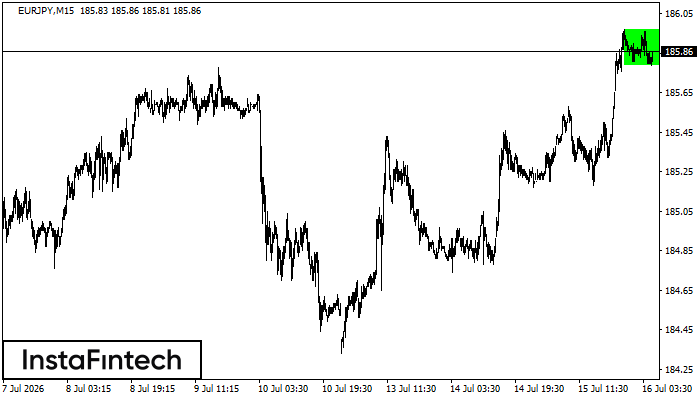
According to the chart of M15, EURJPY formed the Bullish Rectangle. The pattern indicates a trend continuation. The upper border is 185.97, the lower border is 185.79. The signal means that a long position should be opened above the upper border 185.97 of the Bullish Rectangle.
EURJPY M30
Double Top
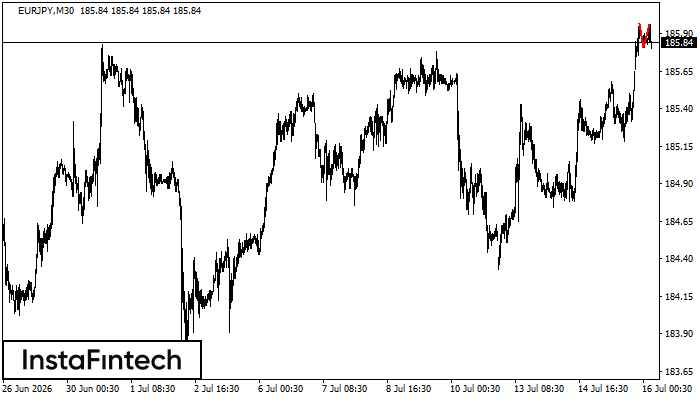
The Double Top reversal pattern has been formed on EURJPY M30. Characteristics: the upper boundary 185.97; the lower boundary 185.81; the width of the pattern is 15 points. Sell trades are better to be opened below the lower boundary 185.81 with a possible movements towards the 185.51 level.
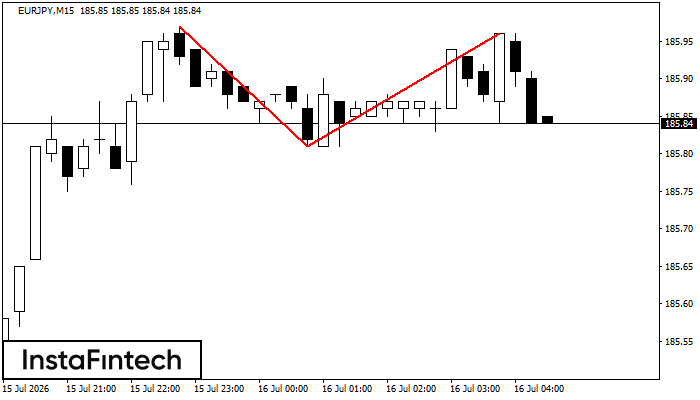
EURJPY M15
Double Top
On the chart of EURJPY M15 the Double Top reversal pattern has been formed. Characteristics: the upper boundary 185.96; the lower boundary 185.81; the width of the pattern 15 points. The signal: a break of the lower boundary will cause continuation of the downward trend targeting the 185.59 level.
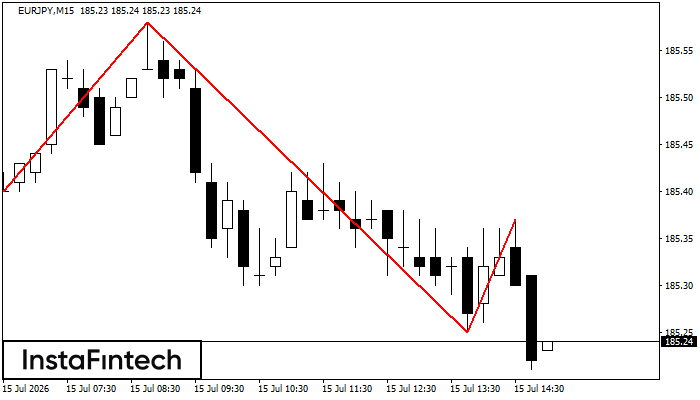
EURJPY M15
Head and Shoulders
The EURJPY M15 formed the Head and Shoulders pattern with the following features: The Head’s top is at 185.58, the Neckline and the upward angle are at 185.20/185.25. The formation of this pattern can bring about changes in the current trend from bullish to bearish. In case the pattern triggers the expected changes, the price of EURJPY will go towards 185.02.
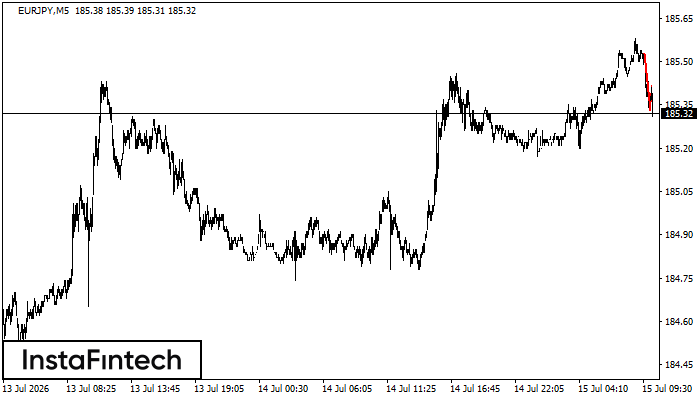
EURJPY M5
Bearish Flag
The Bearish Flag pattern has been formed on the chart EURJPY M5. Therefore, the downwards trend is likely to continue in the nearest term. As soon as the price breaks below the low at 185.33, traders should enter the market.