 Română
  Русский
 English
 Bahasa Indonesia
 Bahasa Malay
 ไทย
ไทย Español
 Deutsch
 Български
 Français
 Tiếng Việt
 中文
中文 বাংলা
বাংলা हिन्दी
 Čeština
 Українська
FX.co ★ Patterns EURNZD | Euro (EUR) to New Zealand Dollar (NZD) Rate in the Forex market


EURNZD M5
Bullish Symmetrical Triangle
According to the chart of M5, EURNZD formed the Bullish Symmetrical Triangle pattern. Description: This is the pattern of a trend continuation. 1.9499 and 1.9472 are the coordinates of the upper and lower borders respectively. The pattern width is measured on the chart at 27 pips. Outlook: If the upper border 1.9499 is broken, the price is likely to continue its move by 1.9503.

EURNZD M5
Bullish Flag
The Bullish Flag pattern has been formed on EURNZD at M5. The lower boundary of the pattern is located at 1.9532/1.9526, while the higher boundary lies at 1.9538/1.9532. The projection of the flagpole is 19 points. This formation signals that the upward trend is most likely to continue. Therefore, if the level of 1.9538 is broken, the price will move further upwards.

EURNZD M5
Bullish pennant
The Bullish pennant pattern is formed on the EURNZD M5 chart. It is a type of the continuation pattern. Supposedly, in case the price is fixed above the pennant’s high of 1.9538, a further uptrend is possible.

EURNZD M15
Triple Bottom
The Triple Bottom pattern has formed on the chart of EURNZD M15. Features of the pattern: The lower line of the pattern has coordinates 1.9551 with the upper limit 1.9551/1.9538, the projection of the width is 30 points. The formation of the Triple Bottom pattern most likely indicates a change in the trend from downward to upward. This means that in the event of a breakdown of the resistance level 1.9521, the price is most likely to continue the upward movement.

EURNZD M5
Double Top
The Double Top reversal pattern has been formed on EURNZD M5. Characteristics: the upper boundary 1.9551; the lower boundary 1.9541; the width of the pattern is 10 points. Sell trades are better to be opened below the lower boundary 1.9541 with a possible movements towards the 1.9526 level.

EURNZD M15
Double Bottom
The Double Bottom pattern has been formed on EURNZD M15. Characteristics: the support level 1.9554; the resistance level 1.9608; the width of the pattern 54 points. If the resistance level is broken, a change in the trend can be predicted with the first target point lying at the distance of 52 points.

EURNZD D1
Triple Bottom
The Triple Bottom pattern has formed on the chart of the EURNZD D1 trading instrument. The pattern signals a change in the trend from downwards to upwards in the case of breakdown of 1.9851/1.9803.

EURNZD D1
Triple Bottom
The Triple Bottom pattern has formed on the chart of the EURNZD D1 trading instrument. The pattern signals a change in the trend from downwards to upwards in the case of breakdown of 1.9851/1.9803.

EURNZD M5
Double Bottom
The Double Bottom pattern has been formed on EURNZD M5. This formation signals a reversal of the trend from downwards to upwards. The signal is that a buy trade should be opened after the upper boundary of the pattern 1.9570 is broken. The further movements will rely on the width of the current pattern 16 points.
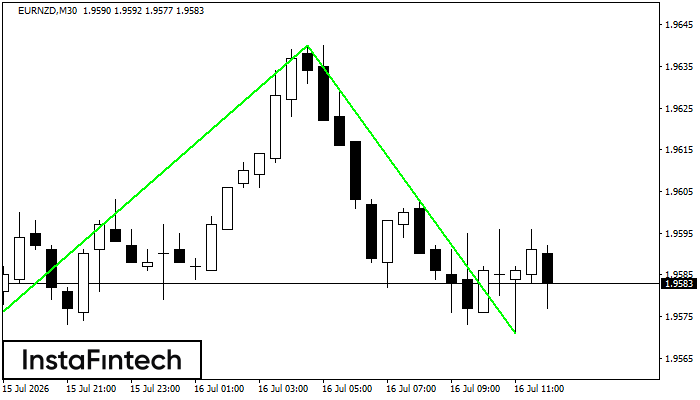
EURNZD M30
Double Bottom
The Double Bottom pattern has been formed on EURNZD M30. This formation signals a reversal of the trend from downwards to upwards. The signal is that a buy trade should be opened after the upper boundary of the pattern 1.9640 is broken. The further movements will rely on the width of the current pattern 67 points.