 Română
  Русский
 English
 Bahasa Indonesia
 Bahasa Malay
 ไทย
ไทย Español
 Deutsch
 Български
 Français
 Tiếng Việt
 中文
中文 বাংলা
বাংলা हिन्दी
 Čeština
 Українська
FX.co ★ Patterns GBPJPY | British Pound (GBP) to Japanese Yen (JPY) Rate in the Forex market


GBPJPY M5
Double Bottom
The Double Bottom pattern has been formed on GBPJPY M5. This formation signals a reversal of the trend from downwards to upwards. The signal is that a buy trade should be opened after the upper boundary of the pattern 218.47 is broken. The further movements will rely on the width of the current pattern 10 points.

GBPJPY M5
Triple Bottom
The Triple Bottom pattern has formed on the chart of GBPJPY M5. Features of the pattern: The lower line of the pattern has coordinates 218.15 with the upper limit 218.15/218.11, the projection of the width is 14 points. The formation of the Triple Bottom pattern most likely indicates a change in the trend from downward to upward. This means that in the event of a breakdown of the resistance level 218.01, the price is most likely to continue the upward movement.

GBPJPY M5
Double Bottom
The Double Bottom pattern has been formed on GBPJPY M5. Characteristics: the support level 218.01; the resistance level 218.15; the width of the pattern 14 points. If the resistance level is broken, a change in the trend can be predicted with the first target point lying at the distance of 13 points.

GBPJPY M5
Double Bottom
The Double Bottom pattern has been formed on GBPJPY M5. Characteristics: the support level 218.02; the resistance level 218.13; the width of the pattern 11 points. If the resistance level is broken, a change in the trend can be predicted with the first target point lying at the distance of 12 points.

GBPJPY M5
Triple Top
On the chart of the GBPJPY M5 trading instrument, the Triple Top pattern that signals a trend change has formed. It is possible that after formation of the third peak, the price will try to break through the resistance level 218.28, where we advise to open a trading position for sale. Take profit is the projection of the pattern’s width, which is 25 points.
GBPJPY M5
Bullish Rectangle
According to the chart of M5, GBPJPY formed the Bullish Rectangle. The pattern indicates a trend continuation. The upper border is 218.43, the lower border is 218.29. The signal means that a long position should be opened above the upper border 218.43 of the Bullish Rectangle.
GBPJPY M5
Triple Top
The Triple Top pattern has formed on the chart of the GBPJPY M5. Features of the pattern: borders have an ascending angle; the lower line of the pattern has the coordinates 218.25/218.29 with the upper limit 218.41/218.43; the projection of the width is 16 points. The formation of the Triple Top figure most likely indicates a change in the trend from upward to downward. This means that in the event of a breakdown of the support level of 218.25, the price is most likely to continue the downward movement.
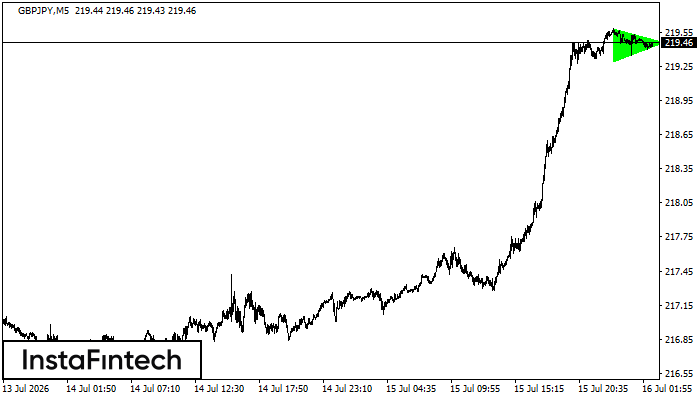
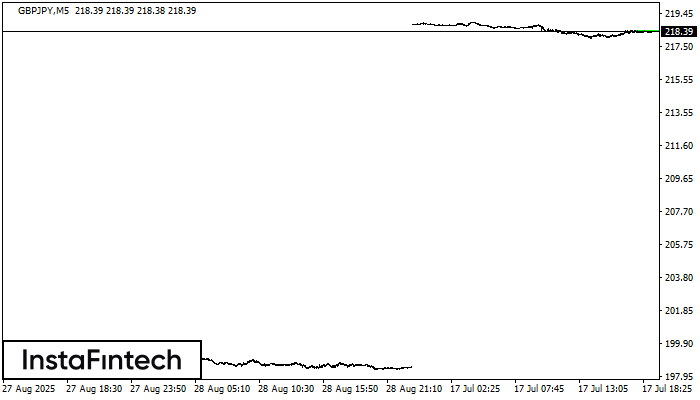
GBPJPY M5
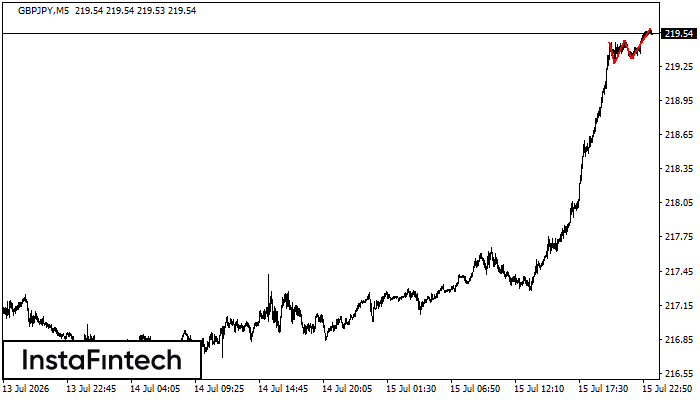
Bullish Symmetrical Triangle
According to the chart of M5, GBPJPY formed the Bullish Symmetrical Triangle pattern. The lower border of the pattern touches the coordinates 219.29/219.46 whereas the upper border goes across 219.58/219.46. If the Bullish Symmetrical Triangle pattern is in progress, this evidently signals a further upward trend. In other words, in case the scenario comes true, the price of GBPJPY will breach the upper border to head for 219.61.
GBPJPY M15
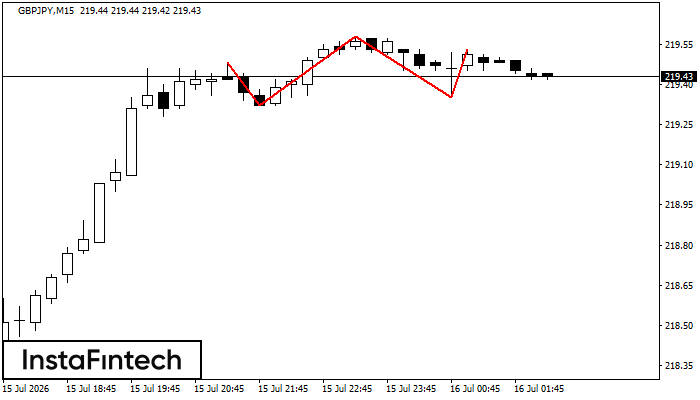
Triple Top
The Triple Top pattern has formed on the chart of the GBPJPY M15 trading instrument. It is a reversal pattern featuring the following characteristics: resistance level -5, support level -3, and pattern’s width 16. Forecast If the price breaks through the support level 219.32, it is likely to move further down to 219.35.
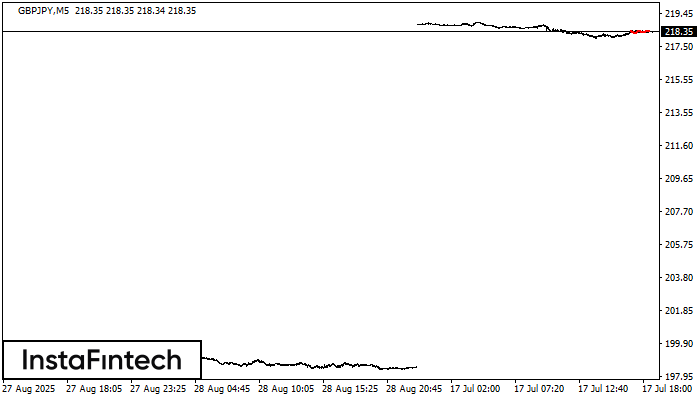
GBPJPY M5
Triple Top
The Triple Top pattern has formed on the chart of the GBPJPY M5 trading instrument. It is a reversal pattern featuring the following characteristics: resistance level -12, support level -4, and pattern’s width 18. Forecast If the price breaks through the support level 219.28, it is likely to move further down to 219.33.