 Română
  Русский
 English
 Bahasa Indonesia
 Bahasa Malay
 ไทย
ไทย Español
 Deutsch
 Български
 Français
 Tiếng Việt
 中文
中文 বাংলা
বাংলা हिन्दी
 Čeština
 Українська
FX.co ★ Patterns GBPUSD | British Pound (GBP) to US Dollar (USD) Rate in the Forex market

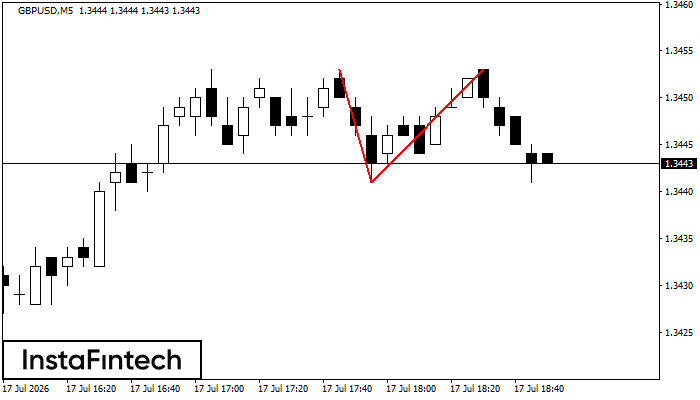
GBPUSD M5
Double Top
The Double Top reversal pattern has been formed on GBPUSD M5. Characteristics: the upper boundary 1.3453; the lower boundary 1.3441; the width of the pattern is 12 points. Sell trades are better to be opened below the lower boundary 1.3441 with a possible movements towards the 1.3426 level.
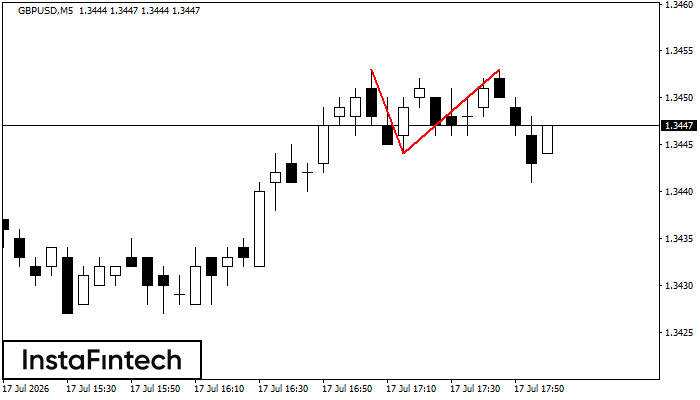
GBPUSD M5
Double Top
The Double Top pattern has been formed on GBPUSD M5. It signals that the trend has been changed from upwards to downwards. Probably, if the base of the pattern 1.3444 is broken, the downward movement will continue.
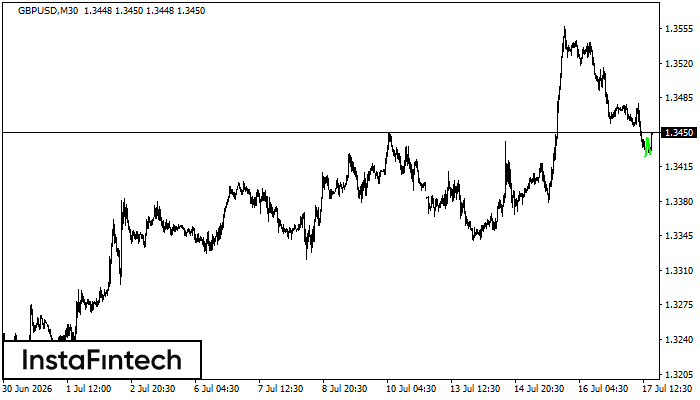
GBPUSD M30
Double Bottom
The Double Bottom pattern has been formed on GBPUSD M30; the upper boundary is 1.3445; the lower boundary is 1.3427. The width of the pattern is 20 points. In case of a break of the upper boundary 1.3445, a change in the trend can be predicted where the width of the pattern will coincide with the distance to a possible take profit level.
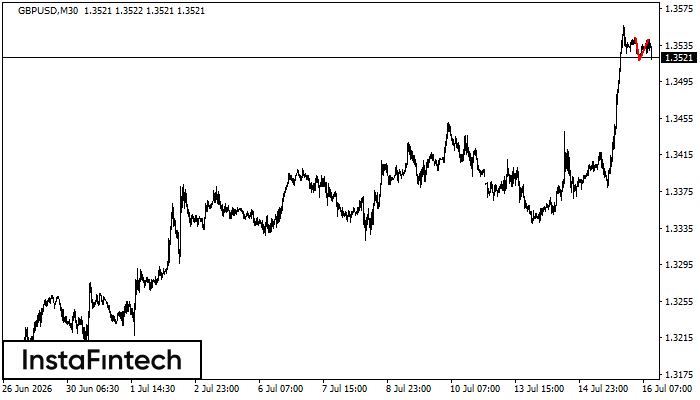
GBPUSD M30
Double Top
On the chart of GBPUSD M30 the Double Top reversal pattern has been formed. Characteristics: the upper boundary 1.3541; the lower boundary 1.3518; the width of the pattern 23 points. The signal: a break of the lower boundary will cause continuation of the downward trend targeting the 1.3488 level.
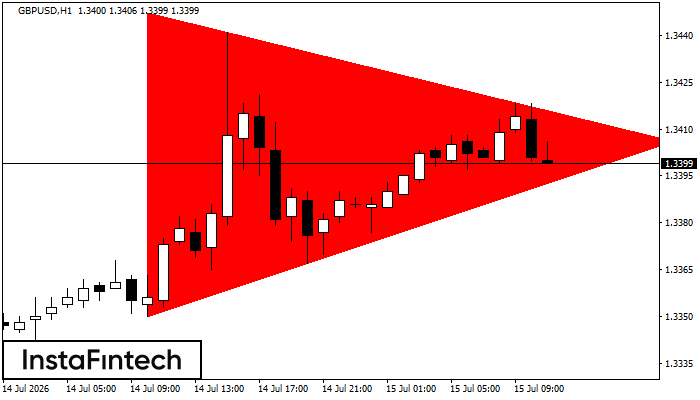
GBPUSD H1
Bearish Symmetrical Triangle
According to the chart of H1, GBPUSD formed the Bearish Symmetrical Triangle pattern. This pattern signals a further downward trend in case the lower border 1.3350 is breached. Here, a hypothetical profit will equal the width of the available pattern that is -97 pips.
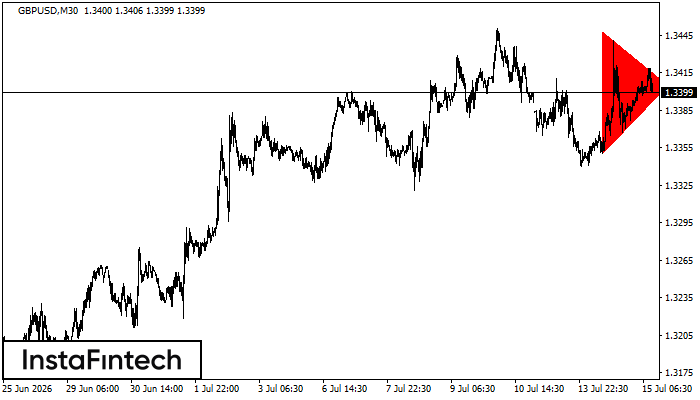
GBPUSD M30
Bearish Symmetrical Triangle
According to the chart of M30, GBPUSD formed the Bearish Symmetrical Triangle pattern. This pattern signals a further downward trend in case the lower border 1.3350 is breached. Here, a hypothetical profit will equal the width of the available pattern that is -98 pips.
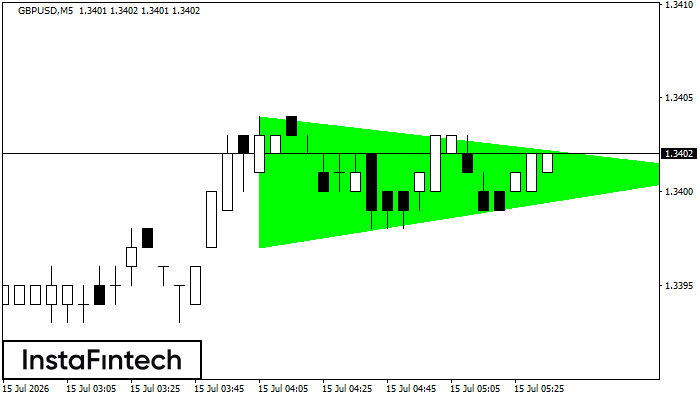
GBPUSD M5
Bullish Symmetrical Triangle
According to the chart of M5, GBPUSD formed the Bullish Symmetrical Triangle pattern, which signals the trend will continue. Description. The upper border of the pattern touches the coordinates 1.3404/1.3401 whereas the lower border goes across 1.3397/1.3401. The pattern width is measured on the chart at 7 pips. If the Bullish Symmetrical Triangle pattern is in progress during the upward trend, this indicates the current trend will go on. In case 1.3401 is broken, the price could continue its move toward 1.3416.
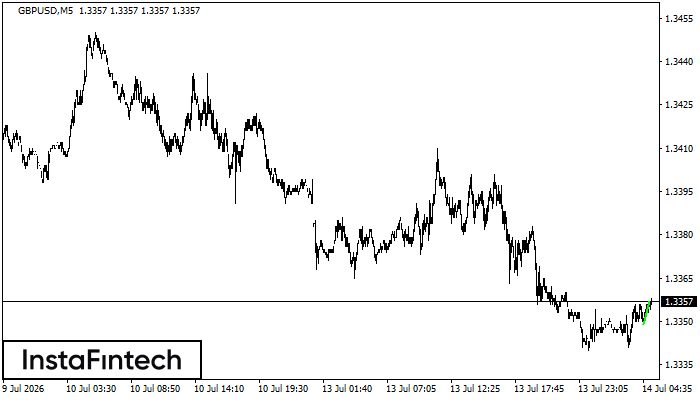
GBPUSD M5
Bullish Flag
The Bullish Flag pattern has been formed on GBPUSD at M5. The lower boundary of the pattern is located at 1.3355/1.3355, while the higher boundary lies at 1.3357/1.3357. The projection of the flagpole is 8 points. This formation signals that the upward trend is most likely to continue. Therefore, if the level of 1.3357 is broken, the price will move further upwards.
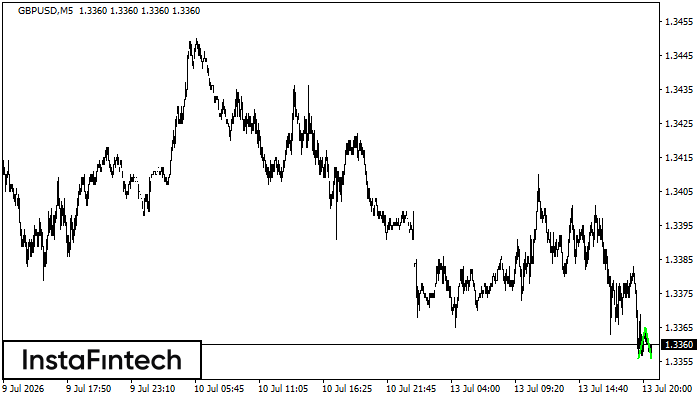
GBPUSD M5
Double Bottom
The Double Bottom pattern has been formed on GBPUSD M5. This formation signals a reversal of the trend from downwards to upwards. The signal is that a buy trade should be opened after the upper boundary of the pattern 1.3365 is broken. The further movements will rely on the width of the current pattern 9 points.
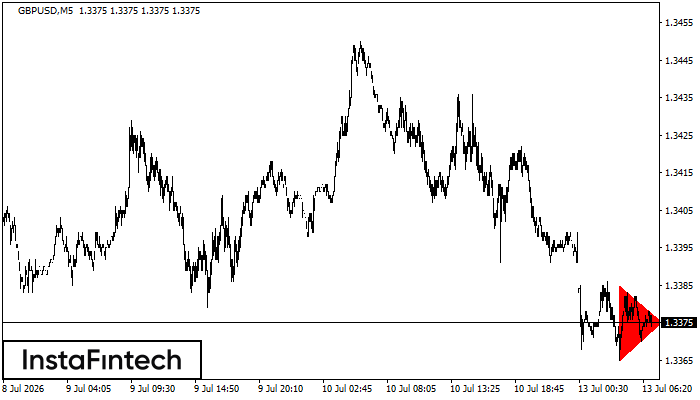
GBPUSD M5
Bearish Symmetrical Triangle
According to the chart of M5, GBPUSD formed the Bearish Symmetrical Triangle pattern. This pattern signals a further downward trend in case the lower border 1.3365 is breached. Here, a hypothetical profit will equal the width of the available pattern that is -20 pips.