 Română
  Русский
 English
 Bahasa Indonesia
 Bahasa Malay
 ไทย
ไทย Español
 Deutsch
 Български
 Français
 Tiếng Việt
 中文
中文 বাংলা
বাংলা हिन्दी
 Čeština
 Українська
FX.co ★ Patterns GOLD | Gold Rate in the Forex market


GOLD D1
Double Bottom
The Double Bottom pattern has been formed on GOLD D1. This formation signals a reversal of the trend from downwards to upwards. The signal is that a buy trade should be opened after the upper boundary of the pattern 4202.52 is broken. The further movements will rely on the width of the current pattern 25942 points.

GOLD M5
Bearish pennant
The Bearish pennant pattern has formed on the GOLD M5 chart. The pattern signals continuation of the downtrend in case the pennant’s low of 3994.49 is broken through. Recommendations: Place the sell stop pending order 10 pips below the pattern’s low. Place the take profit order at the projection distance of the flagpole height.

GOLD M5
Double Bottom
The Double Bottom pattern has been formed on GOLD M5. Characteristics: the support level 4006.11; the resistance level 4015.20; the width of the pattern 909 points. If the resistance level is broken, a change in the trend can be predicted with the first target point lying at the distance of 865 points.

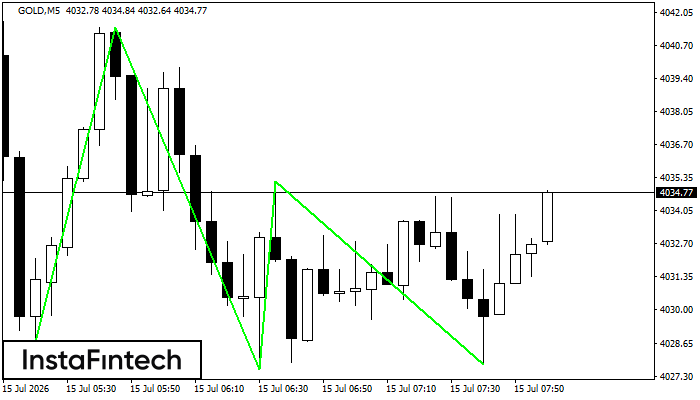
GOLD M5
Double Bottom
The Double Bottom pattern has been formed on GOLD M5. This formation signals a reversal of the trend from downwards to upwards. The signal is that a buy trade should be opened after the upper boundary of the pattern 4030.98 is broken. The further movements will rely on the width of the current pattern 848 points.

GOLD M15
Double Bottom
The Double Bottom pattern has been formed on GOLD M15. This formation signals a reversal of the trend from downwards to upwards. The signal is that a buy trade should be opened after the upper boundary of the pattern 4037.43 is broken. The further movements will rely on the width of the current pattern 1363 points.

GOLD M5
Double Bottom
The Double Bottom pattern has been formed on GOLD M5; the upper boundary is 4073.60; the lower boundary is 4026.46. The width of the pattern is 4853 points. In case of a break of the upper boundary 4073.60, a change in the trend can be predicted where the width of the pattern will coincide with the distance to a possible take profit level.
GOLD M5
Triple Bottom
The Triple Bottom pattern has been formed on GOLD M5. It has the following characteristics: resistance level 4041.44/4035.22; support level 4028.73/4027.78; the width is 1271 points. In the event of a breakdown of the resistance level of 4041.44, the price is likely to continue an upward movement at least to 4027.75.
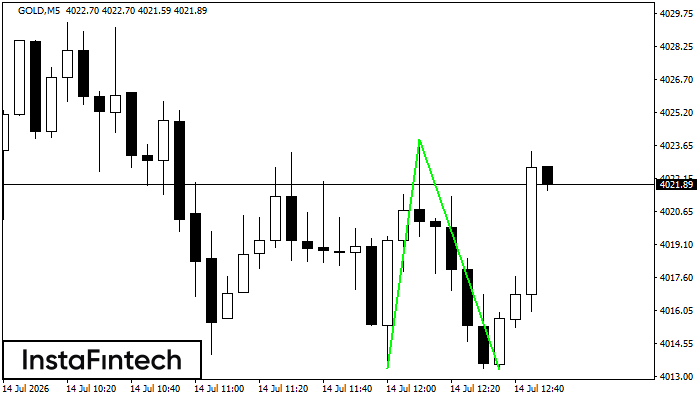
GOLD M5
Double Bottom
The Double Bottom pattern has been formed on GOLD M5. This formation signals a reversal of the trend from downwards to upwards. The signal is that a buy trade should be opened after the upper boundary of the pattern 4023.93 is broken. The further movements will rely on the width of the current pattern 1056 points.
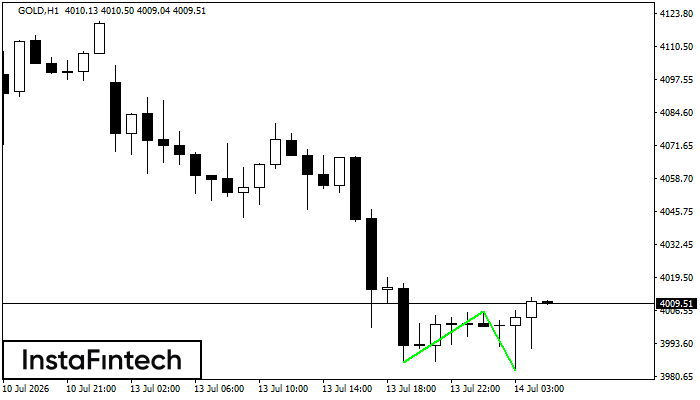
GOLD H1
Double Bottom
The Double Bottom pattern has been formed on GOLD H1. Characteristics: the support level 3986.15; the resistance level 4006.16; the width of the pattern 2001 points. If the resistance level is broken, a change in the trend can be predicted with the first target point lying at the distance of 2306 points.
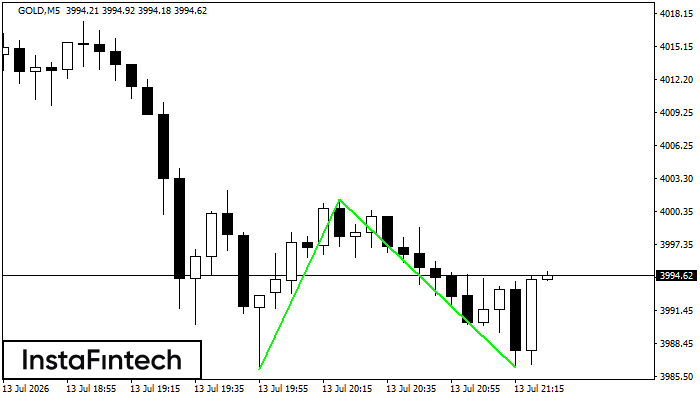
GOLD M5
Double Bottom
The Double Bottom pattern has been formed on GOLD M5. Characteristics: the support level 3986.15; the resistance level 4001.41; the width of the pattern 1526 points. If the resistance level is broken, a change in the trend can be predicted with the first target point lying at the distance of 1510 points.