 Română
  Русский
 English
 Bahasa Indonesia
 Bahasa Malay
 ไทย
ไทย Español
 Deutsch
 Български
 Français
 Tiếng Việt
 中文
中文 বাংলা
বাংলা हिन्दी
 Čeština
 Українська
FX.co ★ Patterns #GOOG | Alphabet Inc. Stock Price


#GOOG M5
Bearish Symmetrical Triangle
According to the chart of M5, #GOOG formed the Bearish Symmetrical Triangle pattern. Trading recommendations: A breach of the lower border 347.16 is likely to encourage a continuation of the downward trend.

#GOOG M5
Double Bottom
The Double Bottom pattern has been formed on #GOOG M5; the upper boundary is 349.47; the lower boundary is 347.16. The width of the pattern is 227 points. In case of a break of the upper boundary 349.47, a change in the trend can be predicted where the width of the pattern will coincide with the distance to a possible take profit level.

#GOOG M30
Bearish pennant
The Bearish pennant pattern has formed on the #GOOG M30 chart. This pattern type is characterized by a slight slowdown after which the price will move in the direction of the original trend. In case the price fixes below the pattern’s low of 341.09, a trader will be able to successfully enter the sell position.

#GOOG M5
Bearish Symmetrical Triangle
According to the chart of M5, #GOOG formed the Bearish Symmetrical Triangle pattern. This pattern signals a further downward trend in case the lower border 344.41 is breached. Here, a hypothetical profit will equal the width of the available pattern that is -356 pips.

#GOOG M5
Bearish pennant
The Bearish pennant pattern has formed on the #GOOG M5 chart. The pattern signals continuation of the downtrend in case the pennant’s low of 341.09 is broken through. Recommendations: Place the sell stop pending order 10 pips below the pattern’s low. Place the take profit order at the projection distance of the flagpole height.

#GOOG M5
Bullish Rectangle
According to the chart of M5, #GOOG formed the Bullish Rectangle. This type of a pattern indicates a trend continuation. It consists of two levels: resistance 372.02 and support 368.38. In case the resistance level 372.02 - 372.02 is broken, the instrument is likely to follow the bullish trend.

#GOOG M15
Double Top
On the chart of #GOOG M15 the Double Top reversal pattern has been formed. Characteristics: the upper boundary 372.02; the lower boundary 368.38; the width of the pattern 364 points. The signal: a break of the lower boundary will cause continuation of the downward trend targeting the 368.15 level.

#GOOG M5
Double Top
The Double Top reversal pattern has been formed on #GOOG M5. Characteristics: the upper boundary 372.00; the lower boundary 368.38; the width of the pattern is 364 points. Sell trades are better to be opened below the lower boundary 368.38 with a possible movements towards the 368.23 level.
#GOOG H1
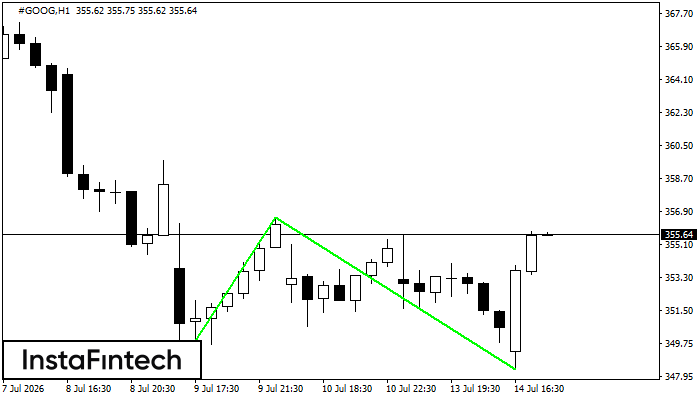
Double Bottom
The Double Bottom pattern has been formed on #GOOG H1. This formation signals a reversal of the trend from downwards to upwards. The signal is that a buy trade should be opened after the upper boundary of the pattern 356.56 is broken. The further movements will rely on the width of the current pattern 800 points.
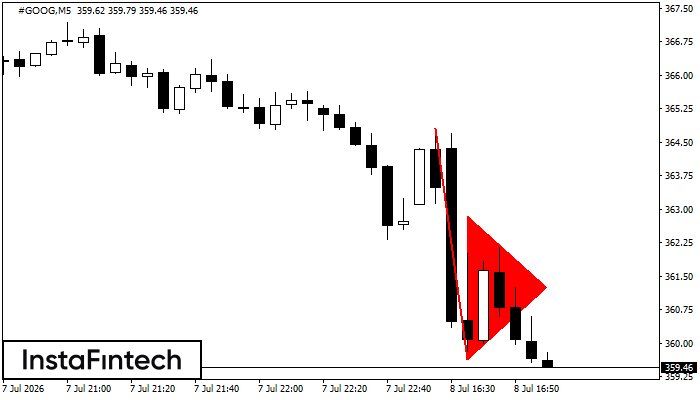
#GOOG M5
Bearish pennant
The Bearish pennant pattern has formed on the #GOOG M5 chart. This pattern type is characterized by a slight slowdown after which the price will move in the direction of the original trend. In case the price fixes below the pattern’s low of 359.64, a trader will be able to successfully enter the sell position.