 Română
  Русский
 English
 Bahasa Indonesia
 Bahasa Malay
 ไทย
ไทย Español
 Deutsch
 Български
 Français
 Tiếng Việt
 中文
中文 বাংলা
বাংলা हिन्दी
 Čeština
 Українська
FX.co ★ Patterns #KO | The Coca-Cola Company Stock Price


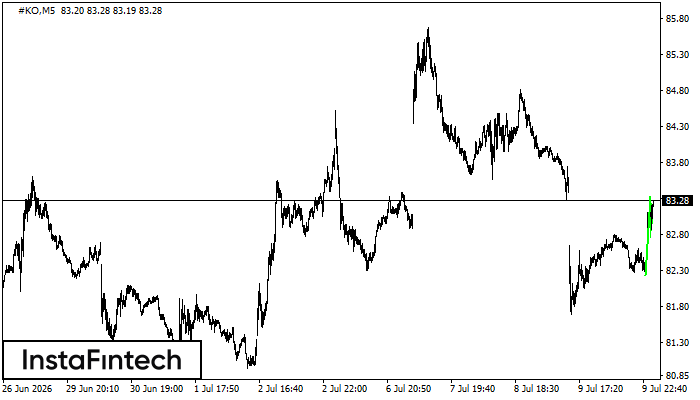
#KO M5
Double Top
The Double Top pattern has been formed on #KO M5. It signals that the trend has been changed from upwards to downwards. Probably, if the base of the pattern 81.31 is broken, the downward movement will continue.

#KO M5
Double Bottom
The Double Bottom pattern has been formed on #KO M5. This formation signals a reversal of the trend from downwards to upwards. The signal is that a buy trade should be opened after the upper boundary of the pattern 82.35 is broken. The further movements will rely on the width of the current pattern 103 points.
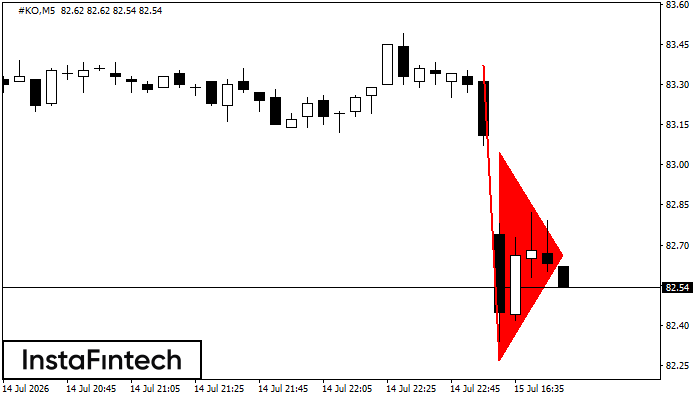
#KO M5
Bearish pennant
The Bearish pennant pattern has formed on the #KO M5 chart. The pattern signals continuation of the downtrend in case the pennant’s low of 82.27 is broken through. Recommendations: Place the sell stop pending order 10 pips below the pattern’s low. Place the take profit order at the projection distance of the flagpole height.
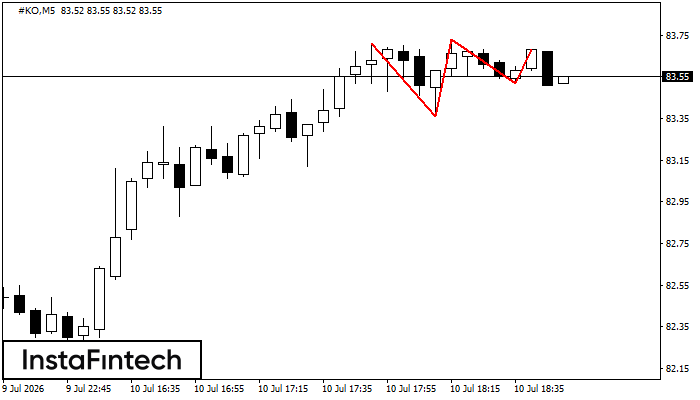
#KO M5
Triple Bottom
The Triple Bottom pattern has formed on the chart of #KO M5. Features of the pattern: The lower line of the pattern has coordinates 83.38 with the upper limit 83.38/83.36, the projection of the width is 18 points. The formation of the Triple Bottom pattern most likely indicates a change in the trend from downward to upward. This means that in the event of a breakdown of the resistance level 83.20, the price is most likely to continue the upward movement.
#KO M5
Triple Top
On the chart of the #KO M5 trading instrument, the Triple Top pattern that signals a trend change has formed. It is possible that after formation of the third peak, the price will try to break through the resistance level 83.36, where we advise to open a trading position for sale. Take profit is the projection of the pattern’s width, which is 35 points.
#KO M5
Double Top
On the chart of #KO M5 the Double Top reversal pattern has been formed. Characteristics: the upper boundary 83.73; the lower boundary 83.36; the width of the pattern 37 points. The signal: a break of the lower boundary will cause continuation of the downward trend targeting the 83.21 level.
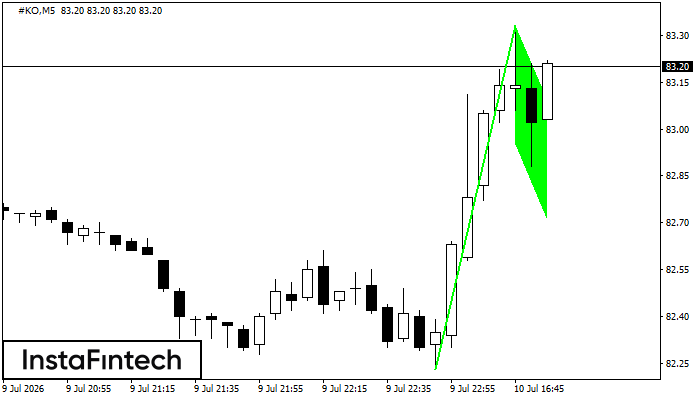
#KO M5
Bullish pennant
The Bullish pennant pattern is formed on the #KO M5 chart. It is a type of the continuation pattern. Supposedly, in case the price is fixed above the pennant’s high of 83.33, a further uptrend is possible.
#KO M5
Bullish Flag
The Bullish Flag pattern which signals continuation of a trend has been formed on the chart #KO M5. Forecast: if the price breaks above the pattern high at 83.33, then traders will be able to place a long deal with the target at 83.48.
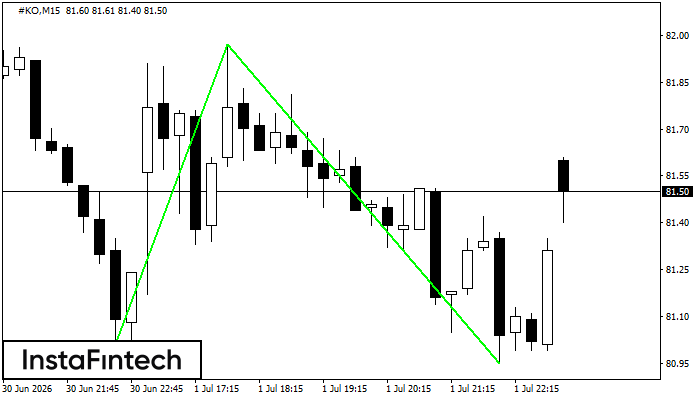
#KO M15
Double Bottom
The Double Bottom pattern has been formed on #KO M15; the upper boundary is 81.97; the lower boundary is 80.95. The width of the pattern is 96 points. In case of a break of the upper boundary 81.97, a change in the trend can be predicted where the width of the pattern will coincide with the distance to a possible take profit level.
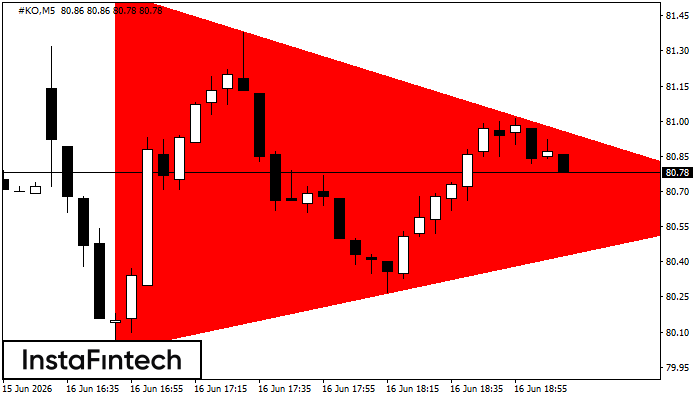
#KO M5
Bearish Symmetrical Triangle
According to the chart of M5, #KO formed the Bearish Symmetrical Triangle pattern. Description: The lower border is 80.02/80.64 and upper border is 81.55/80.64. The pattern width is measured on the chart at -153 pips. The formation of the Bearish Symmetrical Triangle pattern evidently signals a continuation of the downward trend. In other words, if the scenario comes true and #KO breaches the lower border, the price could continue its move toward 80.49.