 Română
  Русский
 English
 Bahasa Indonesia
 Bahasa Malay
 ไทย
ไทย Español
 Deutsch
 Български
 Français
 Tiếng Việt
 中文
中文 বাংলা
বাংলা हिन्दी
 Čeština
 Українська
FX.co ★ Patterns SILVER | Silver Rate in the Forex market


SILVER M30
Double Top
On the chart of SILVER M30 the Double Top reversal pattern has been formed. Characteristics: the upper boundary 59.15; the lower boundary 58.22; the width of the pattern 930 points. The signal: a break of the lower boundary will cause continuation of the downward trend targeting the 58.19 level.

SILVER M5
Double Top
On the chart of SILVER M5 the Double Top reversal pattern has been formed. Characteristics: the upper boundary 59.15; the lower boundary 58.22; the width of the pattern 930 points. The signal: a break of the lower boundary will cause continuation of the downward trend targeting the 58.20 level.

SILVER M30
Double Top
The Double Top reversal pattern has been formed on SILVER M30. Characteristics: the upper boundary 59.19; the lower boundary 58.65; the width of the pattern is 485 points. Sell trades are better to be opened below the lower boundary 58.65 with a possible movements towards the 58.62 level.

SILVER M15
Double Bottom
The Double Bottom pattern has been formed on SILVER M15; the upper boundary is 57.12; the lower boundary is 56.38. The width of the pattern is 765 points. In case of a break of the upper boundary 57.12, a change in the trend can be predicted where the width of the pattern will coincide with the distance to a possible take profit level.

SILVER M5
Bearish Symmetrical Triangle
According to the chart of M5, SILVER formed the Bearish Symmetrical Triangle pattern. Description: The lower border is 56.35/56.76 and upper border is 57.20/56.76. The pattern width is measured on the chart at -846 pips. The formation of the Bearish Symmetrical Triangle pattern evidently signals a continuation of the downward trend. In other words, if the scenario comes true and SILVER breaches the lower border, the price could continue its move toward 56.75.

SILVER M5
Bullish Symmetrical Triangle
According to the chart of M5, SILVER formed the Bullish Symmetrical Triangle pattern. Description: This is the pattern of a trend continuation. 57.15 and 56.59 are the coordinates of the upper and lower borders respectively. The pattern width is measured on the chart at 558 pips. Outlook: If the upper border 57.15 is broken, the price is likely to continue its move by 56.88.

SILVER M5
Double Bottom
The Double Bottom pattern has been formed on SILVER M5. Characteristics: the support level 56.33; the resistance level 57.31; the width of the pattern 985 points. If the resistance level is broken, a change in the trend can be predicted with the first target point lying at the distance of 970 points.

SILVER M5
Bearish pennant
The Bearish pennant pattern has formed on the SILVER M5 chart. The pattern signals continuation of the downtrend in case the pennant’s low of 55.53 is broken through. Recommendations: Place the sell stop pending order 10 pips below the pattern’s low. Place the take profit order at the projection distance of the flagpole height.

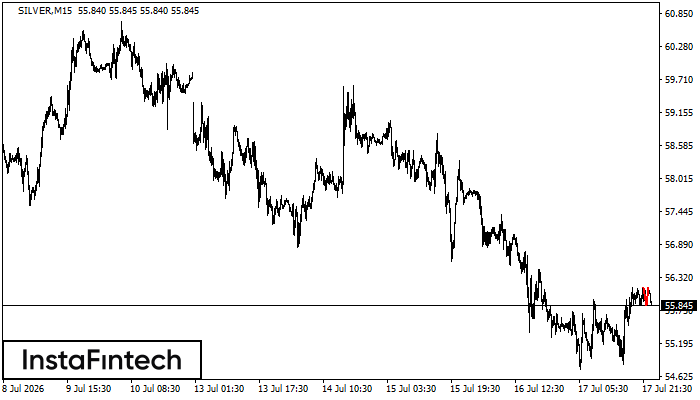
SILVER M15
Double Top
The Double Top reversal pattern has been formed on SILVER M15. Characteristics: the upper boundary 56.15; the lower boundary 55.84; the width of the pattern is 305 points. Sell trades are better to be opened below the lower boundary 55.84 with a possible movements towards the 55.82 level.
SILVER M15
Double Top
On the chart of SILVER M15 the Double Top reversal pattern has been formed. Characteristics: the upper boundary 56.15; the lower boundary 55.84; the width of the pattern 305 points. The signal: a break of the lower boundary will cause continuation of the downward trend targeting the 55.82 level.