 Română
 Русский
 English
 Bahasa Indonesia
 Bahasa Malay
 ไทย
ไทย Español
 Deutsch
 Български
 Français
 Tiếng Việt
 中文
中文 বাংলা
বাংলা हिन्दी
 Čeština
 Українська
FX.co ★ Patterns #TSLA | Tesla, Inc. Stock Price

#TSLA M5
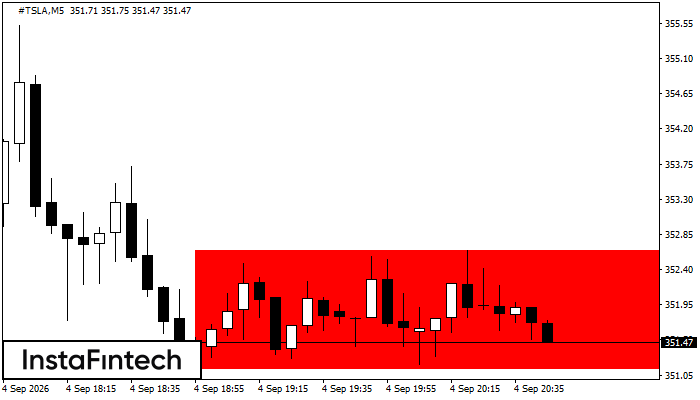
Bearish Rectangle
The Bearish Rectangle has formed on the #TSLA M5 chart and indicates a likely continuation of the trend. Its resistance zone is at 352.64–352.64 and its support zone is at 351.12–351.12. A break below support at 351.12 is likely to signal a continuation of the bearish trend.
#TSLA M15
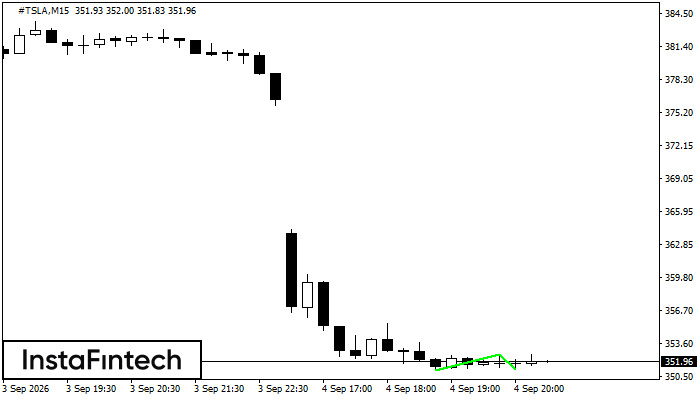
Double Bottom
The Double Bottom pattern has formed on the #TSLA M15 chart. Its upper boundary is at 352.57, its lower boundary is at 351.19, and its width is 145 points. A break above the upper boundary at 352.57 may confirm a trend reversal, with the pattern width defining the projected distance to a potential Take Profit level.
#TSLA M15
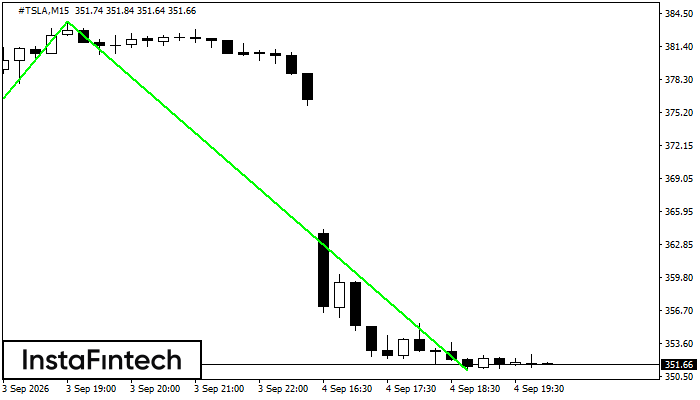
Double Bottom
The Double Bottom pattern has formed on the #TSLA M15 chart. Its upper boundary is at 383.76, its lower boundary is at 351.12, and its width is 3226 points. A break above the upper boundary at 383.76 may confirm a trend reversal, with the pattern width defining the projected distance to a potential Take Profit level.
#TSLA M5
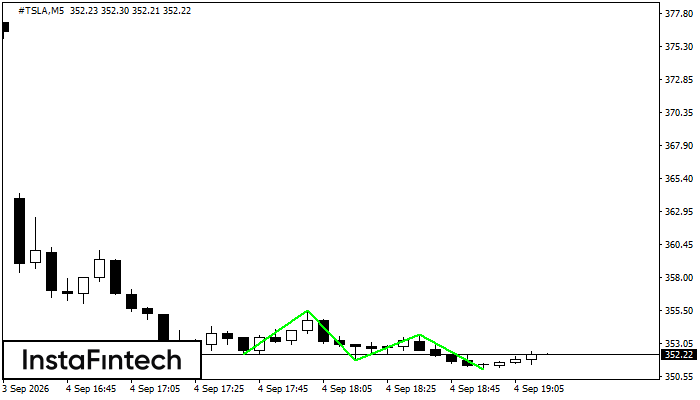
Triple Bottom
The Triple Bottom pattern has formed on the #TSLA M5 chart. A break above the confirmation resistance at 355.53 may signal a reversal from a downtrend to an uptrend.
#TSLA M5
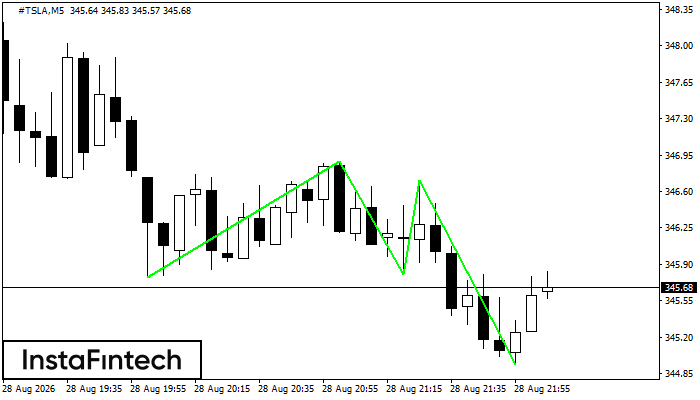
Triple Bottom
The Triple Bottom pattern has formed on the #TSLA M5 chart. It has the following characteristics: resistance at 346.71; support at 344.94; pattern width of 177 points. If the confirmation resistance at 346.89 is broken, the price is likely to continue upward by at least 109 points.
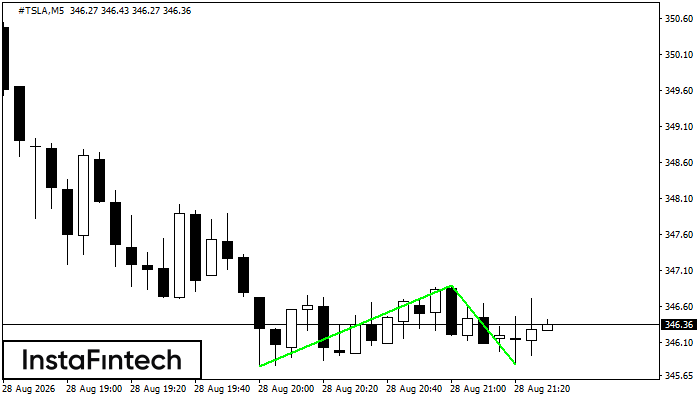
#TSLA M5
Double Bottom
The Double Bottom pattern has formed on the #TSLA M5 chart and signals a potential reversal from a downtrend to an uptrend. A long position may be considered after the price breaks above the upper boundary at 346.89. The projected move is based on the pattern width of 112 points.
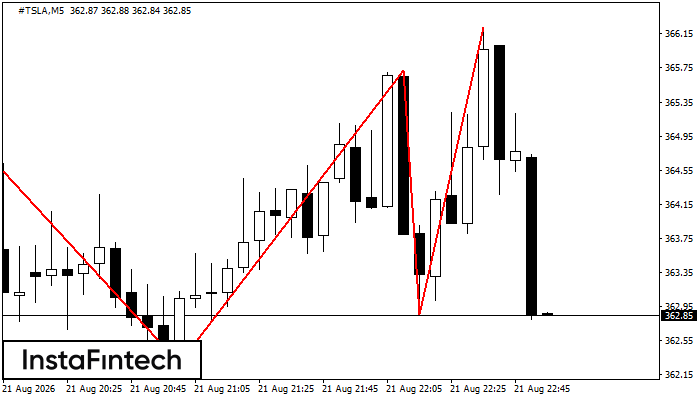
#TSLA M5
Triple Top
The Triple Top reversal pattern has formed on the #TSLA M5 chart. Its upper boundary is at 364.73/366.23, its lower boundary is at 362.28/362.86, and its current width is 286 points. If the confirmation support at 362.28 is broken, that width can be used to project the downward move.
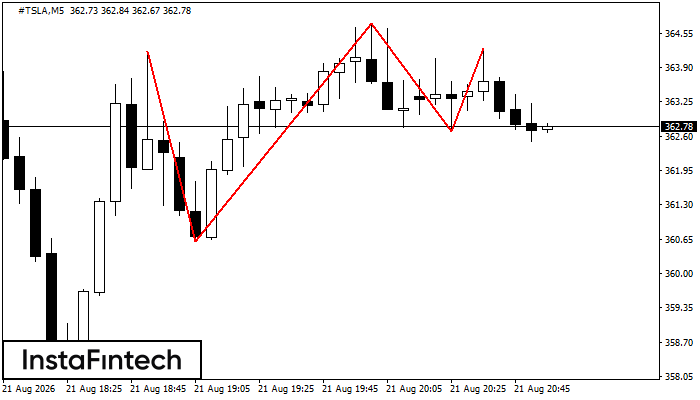
#TSLA M5
Triple Top
The Triple Top reversal pattern has formed on the #TSLA M5 chart. Its upper boundary is at 364.20/364.26, its lower boundary is at 360.60/362.68, and its current width is 205 points. If the confirmation support at 360.60 is broken, that width can be used to project the downward move.
#TSLA M5
Triple Top
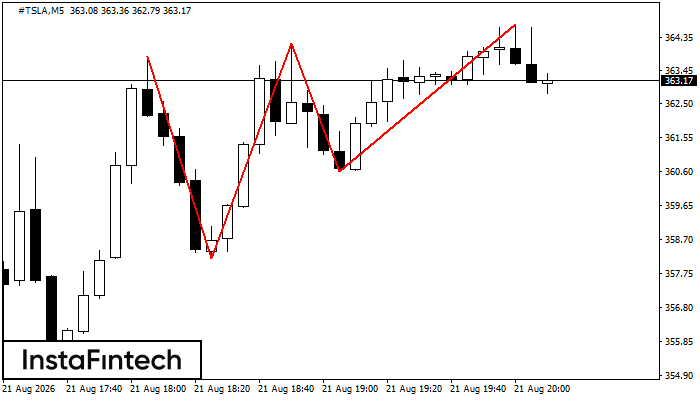
The Triple Top reversal pattern has formed on the #TSLA M5 chart. Its upper boundary is at 363.83/364.73, its lower boundary is at 358.17/360.60, and its current width is 360 points. If the confirmation support at 358.17 is broken, that width can be used to project the downward move.
#TSLA M5
Double Top
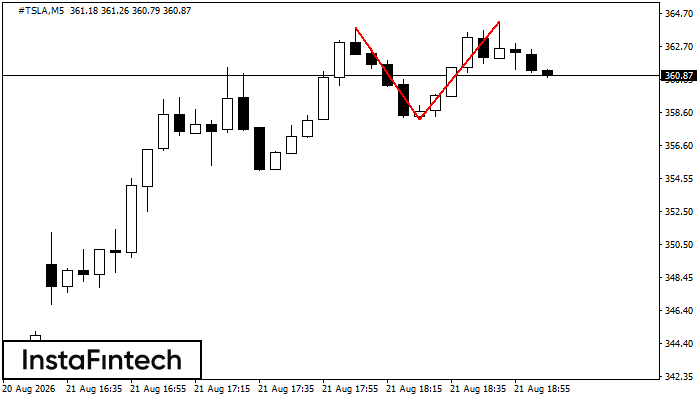
The Double Top pattern has formed on the #TSLA M5 chart and signals a potential reversal from an uptrend to a downtrend. A break below the pattern base at 358.17 is likely to confirm further downward movement.