 Română
  Русский
 English
 Bahasa Indonesia
 Bahasa Malay
 ไทย
ไทย Español
 Deutsch
 Български
 Français
 Tiếng Việt
 中文
中文 বাংলা
বাংলা हिन्दी
 Čeština
 Українська
FX.co ★ Patterns USDCAD | US Dollar (USD) to the Canadian Dollar (CAD) Rate in the Forex market


USDCAD M5
Double Top
On the chart of USDCAD M5 the Double Top reversal pattern has been formed. Characteristics: the upper boundary 1.4087; the lower boundary 1.4077; the width of the pattern 10 points. The signal: a break of the lower boundary will cause continuation of the downward trend targeting the 1.4062 level.

USDCAD M15
Head and Shoulders
The technical pattern called Head and Shoulders has appeared on the chart of USDCAD M15. There are weighty reasons to suggest that the price will surpass the Neckline 1.4052/1.4057 after the right shoulder has been formed. So, the trend is set to change with the price heading for 1.4035.

USDCAD H1
Bearish Flag
The Bearish Flag pattern has been formed on the chart USDCAD H1. Therefore, the downwards trend is likely to continue in the nearest term. As soon as the price breaks below the low at 1.3999, traders should enter the market.

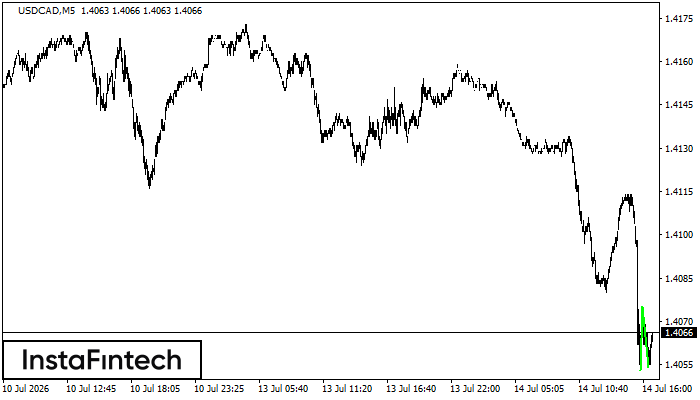
USDCAD H1
Bearish pennant
The Bearish pennant pattern has formed on the USDCAD H1 chart. This pattern type is characterized by a slight slowdown after which the price will move in the direction of the original trend. In case the price fixes below the pattern’s low of 1.3999, a trader will be able to successfully enter the sell position.

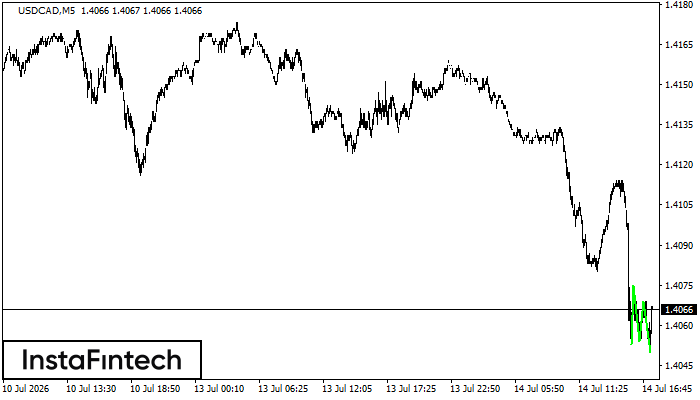
USDCAD H1
Double Bottom
The Double Bottom pattern has been formed on USDCAD H1. This formation signals a reversal of the trend from downwards to upwards. The signal is that a buy trade should be opened after the upper boundary of the pattern 1.4022 is broken. The further movements will rely on the width of the current pattern 18 points.
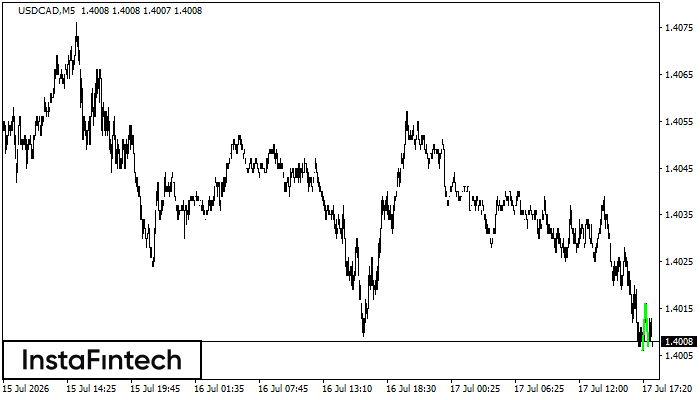
USDCAD M5
Double Bottom
The Double Bottom pattern has been formed on USDCAD M5; the upper boundary is 1.4016; the lower boundary is 1.4007. The width of the pattern is 10 points. In case of a break of the upper boundary 1.4016, a change in the trend can be predicted where the width of the pattern will coincide with the distance to a possible take profit level.
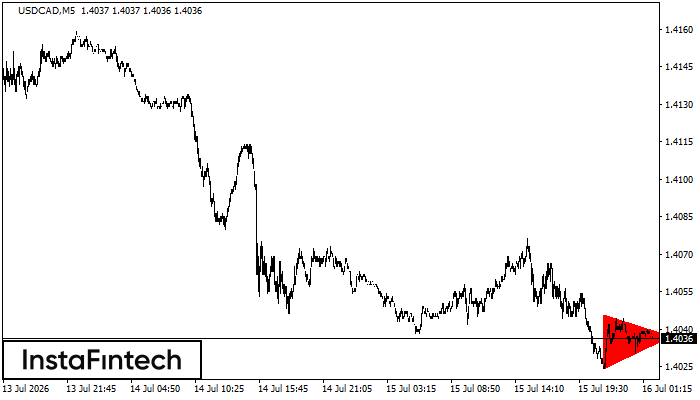
USDCAD M5
Bearish Symmetrical Triangle
According to the chart of M5, USDCAD formed the Bearish Symmetrical Triangle pattern. Description: The lower border is 1.4024/1.4037 and upper border is 1.4046/1.4037. The pattern width is measured on the chart at -22 pips. The formation of the Bearish Symmetrical Triangle pattern evidently signals a continuation of the downward trend. In other words, if the scenario comes true and USDCAD breaches the lower border, the price could continue its move toward 1.4022.
USDCAD M5
Triple Bottom
The Triple Bottom pattern has been formed on USDCAD M5. It has the following characteristics: resistance level 1.4075/1.4069; support level 1.4053/1.4050; the width is 22 points. In the event of a breakdown of the resistance level of 1.4075, the price is likely to continue an upward movement at least to 1.4069.
USDCAD M5
Double Bottom
The Double Bottom pattern has been formed on USDCAD M5; the upper boundary is 1.4075; the lower boundary is 1.4054. The width of the pattern is 22 points. In case of a break of the upper boundary 1.4075, a change in the trend can be predicted where the width of the pattern will coincide with the distance to a possible take profit level.
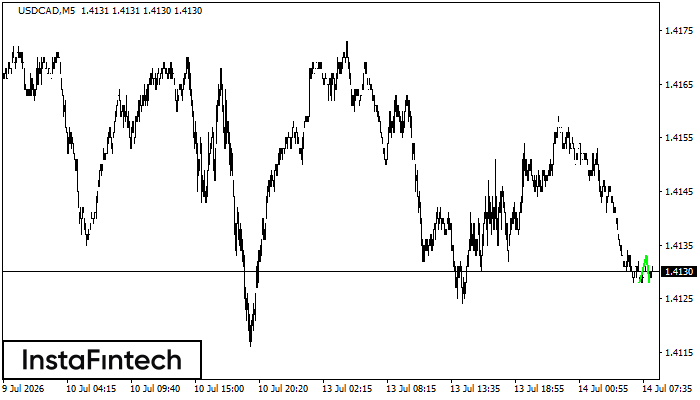
USDCAD M5
Double Bottom
The Double Bottom pattern has been formed on USDCAD M5. Characteristics: the support level 1.4128; the resistance level 1.4133; the width of the pattern 5 points. If the resistance level is broken, a change in the trend can be predicted with the first target point lying at the distance of 5 points.