 Español
  Русский
 English
 Bahasa Indonesia
 Bahasa Malay
 ไทย
ไทย Deutsch
 Български
 Français
 Tiếng Việt
 中文
中文 বাংলা
বাংলা हिन्दी
 Čeština
 Українська
 Română

The index remains bearish below the 200 SMA at H1 chart and the support level of 93.55 is still helping to contain further bearish advance in the short-term. If that level gives up, then we might expect a leg lower to test the 93.12 zone. To the upside, the 200 SMA at H1 chart is the nearest resistance to pierce.
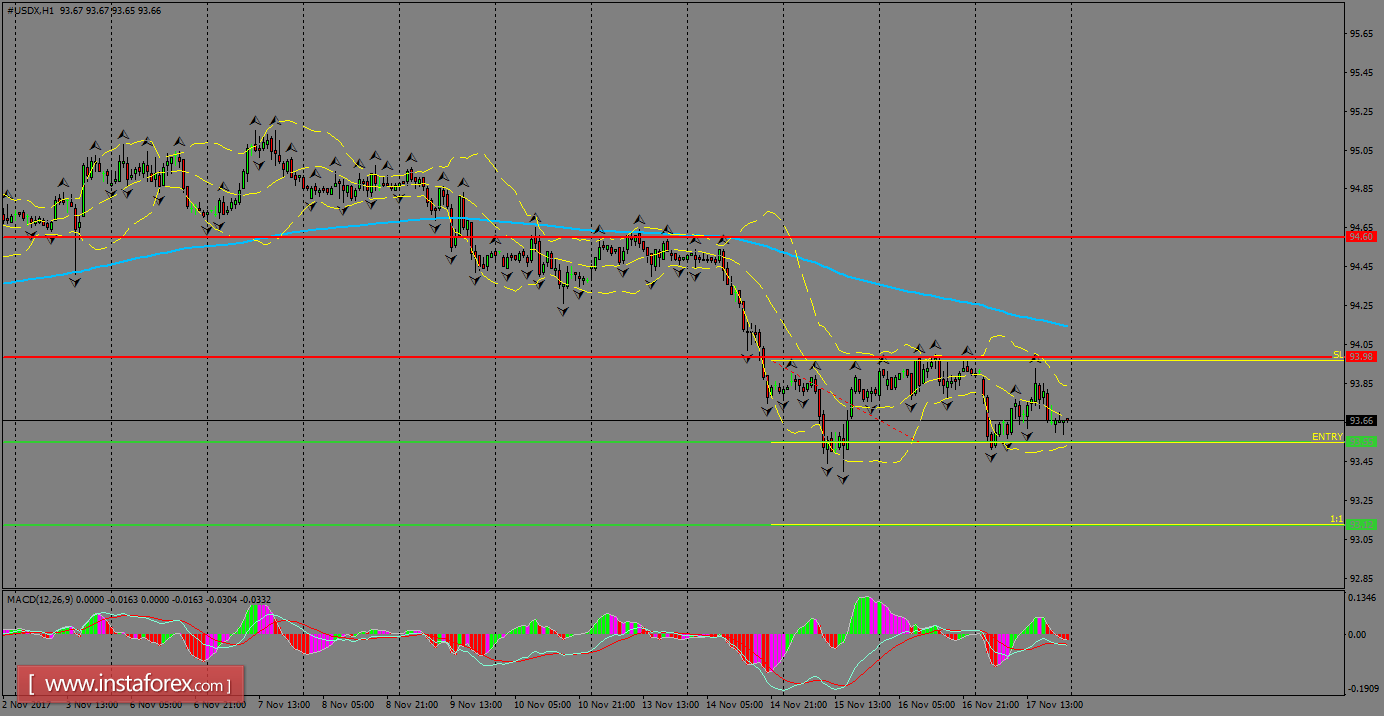
H1 chart's resistance levels: 93.98 / 94.60
H1 chart's support levels: 93.55 / 93.12
Trading recommendations for today: Based on the H1 chart, place sell (short) orders only if the USD Index breaks with a bearish candlestick; the support level is at 93.55, take profit is at 93.12 and stop loss is at 93.97.