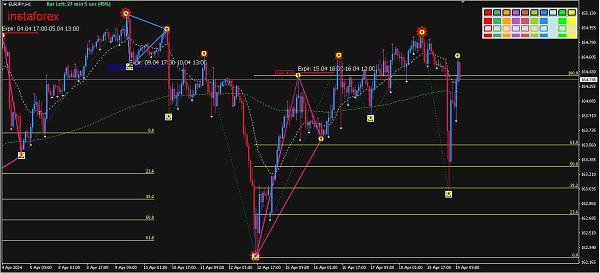
Hello everyone! Chart of the currency pair EURJPY. After reaching the daily range highs, the EURJPY pair turned around and temporarily moved south, resulting in the appearance of an opaque minor candle with bearish dominance. During today's Asian session, sellers pushed the price down with a strong southern impulse, but now there is a strong corrective pullback, and if a clear northern reversal candle appears today, I would expect buyers to retest it, heading towards the nearest resistance levels. In this case, the resistance levels of 165.17 and 165.36 will be of interest. There are two possible scenarios regarding these resistance levels. The first scenario is that prices will settle above these levels and move higher. If this plan works out, I would expect the price to move towards the resistance line at 169.97. Of course, I understand that as the price moves towards the northern target, there may be a pullback to the south; a possible price movement near the resistance levels of 165.17 or 165.36 will allow the formation of a reversal candle and continue the implementation of the downward plan. If this plan is successful, I would expect the price to return to the support level at 162.61. Around this support level, I would continue to look for bullish signals in hopes of a price movement continuation. Of course, there is also a possibility to consider a more distant southern target, but I am not considering this option at the moment, as it is unlikely to be realized in the near future. However, if the daily range forms a bullish engulfing candle, I would expect the discovery of the final resistance level.
*El análisis de mercado publicado aquí está destinado a aumentar su conocimiento, pero no a dar instrucciones sobre cómo realizar una operación
 Español
  Русский
 English
 Bahasa Indonesia
 Bahasa Malay
 ไทย
ไทย Deutsch
 Български
 Français
 Tiếng Việt
 中文
中文 বাংলা
বাংলা हिन्दी
 Čeština
 Українська
 Română