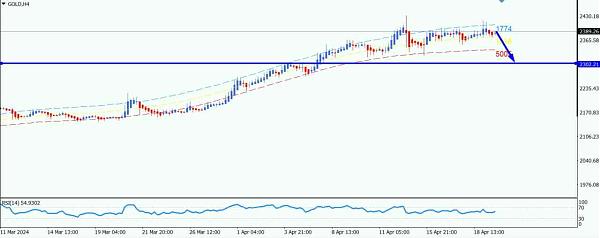
#GOLD / Gold / XAUUSD H4. Analyzing the Heiken Ashi candlestick readings in combination with TMA (Triangular Moving Average) and RSI indicators for the selected currency pair/instrument, it can be concluded that currently the market favors a decline in price and a significant increase in selling pressure. The Heiken Ashi candle indicator, which indicates the current market sentiment, helps smooth out noise on the charts, thereby significantly facilitating technical analysis and increasing the accuracy of trading decisions. The TMA channel indicator (lines of red, blue, and yellow colors) constructs support and resistance lines based on twice-smoothed moving averages and indicates the current boundaries of the instrument's movement. As an auxiliary oscillator that shows excellent results in combination with Heiken Ashi, it is useful to utilize the RSI indicator. (URL) On the chart of the analyzed pair, it can be seen that the candles have turned red, indicating the bears' dominance. The price has crossed above the upper channel boundary (blue dashed line) and after bouncing off the peak, it is heading back towards its middle line (yellow dashed line). At the same time, the RSI oscillator also fully confirms the sell signal, as its curve is currently pointing downwards and is not close to the oversold level. Therefore, it can be inferred that there is a good opportunity to enter a profitable short selling trade aiming for the lower channel boundary (red dashed line) at the price level of 2302.
*El análisis de mercado publicado aquí está destinado a aumentar su conocimiento, pero no a dar instrucciones sobre cómo realizar una operación
 Español
  Русский
 English
 Bahasa Indonesia
 Bahasa Malay
 ไทย
ไทย Deutsch
 Български
 Français
 Tiếng Việt
 中文
中文 বাংলা
বাংলা हिन्दी
 Čeština
 Українська
 Română