 中文
中文  Русский
 English
 Bahasa Indonesia
 Bahasa Malay
 ไทย
ไทย Español
 Deutsch
 Български
 Français
 Tiếng Việt
 বাংলা
বাংলা हिन्दी
 Čeština
 Українська
 Română
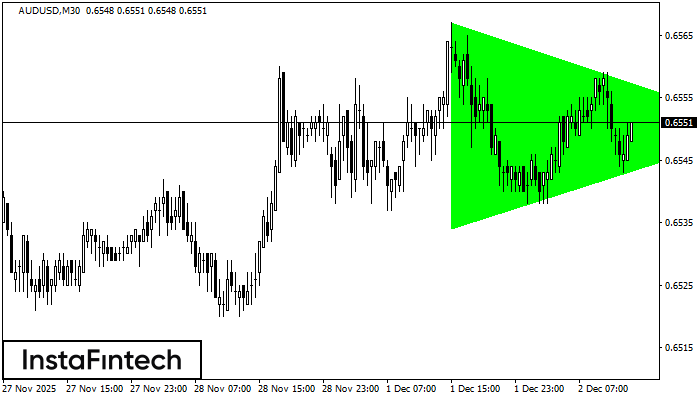 According to the chart of M30, AUDUSD formed the Bullish Symmetrical Triangle pattern. Description: This is the pattern of a trend continuation. 0.6567 and 0.6534 are the coordinates of the upper and lower borders respectively. The pattern width is measured on the chart at 33 pips. Outlook: If the upper border 0.6567 is broken, the price is likely to continue its move by 0.6580.
 FX.co ★ AUDUSD M30: Bullish Symmetrical Triangle
Signal strength 3 of 5
AUDUSD M30: Bullish Symmetrical Triangle
According to the chart of M30, AUDUSD formed the Bullish Symmetrical Triangle pattern. Description: This is the pattern of a trend continuation. 0.6567 and 0.6534 are the coordinates of the upper and lower borders respectively. The pattern width is measured on the chart at 33 pips. Outlook: If the upper border 0.6567 is broken, the price is likely to continue its move by 0.6580. *此处发布的市场分析旨在提高您的意识,但不提供交易指示