 中文
中文  Русский
 English
 Bahasa Indonesia
 Bahasa Malay
 ไทย
ไทย Español
 Deutsch
 Български
 Français
 Tiếng Việt
 বাংলা
বাংলা हिन्दी
 Čeština
 Українська
 Română
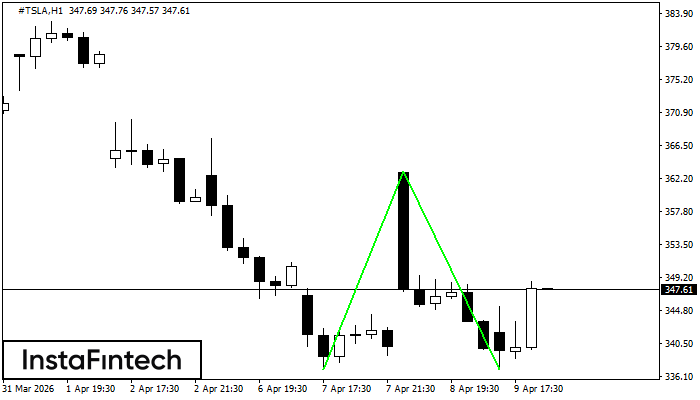 The Double Bottom pattern has been formed on #TSLA H1. This formation signals a reversal of the trend from downwards to upwards. The signal is that a buy trade should be opened after the upper boundary of the pattern 363.12 is broken. The further movements will rely on the width of the current pattern 2611 points.
 FX.co ★ #TSLA H1: Double Bottom
Signal strength 4 of 5
#TSLA H1: Double Bottom
The Double Bottom pattern has been formed on #TSLA H1. This formation signals a reversal of the trend from downwards to upwards. The signal is that a buy trade should be opened after the upper boundary of the pattern 363.12 is broken. The further movements will rely on the width of the current pattern 2611 points. *此处发布的市场分析旨在提高您的意识,但不提供交易指示