 中文
中文  Русский
 English
 Bahasa Indonesia
 Bahasa Malay
 ไทย
ไทย Español
 Deutsch
 Български
 Français
 Tiếng Việt
 বাংলা
বাংলা हिन्दी
 Čeština
 Українська
 Română
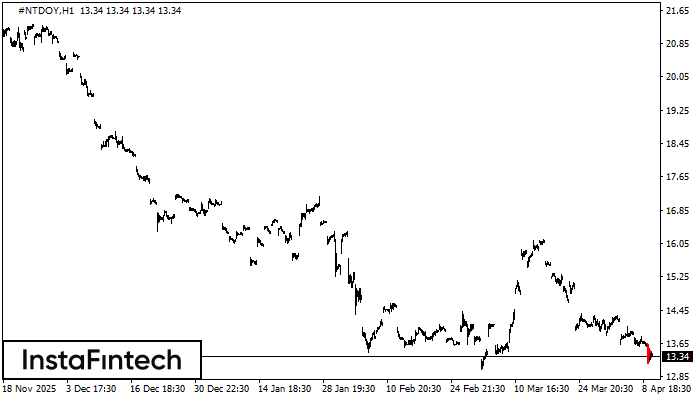 The Bearish pennant pattern has formed on the #NTDOY H1 chart. It signals potential continuation of the existing trend. Specifications: the pattern’s bottom has the coordinate of 13.16; the projection of the flagpole height is equal to 49 pips. In case the price breaks out the pattern’s bottom of 13.16, the downtrend is expected to continue for further level 12.76.
 FX.co ★ #NTDOY H1: Bearish pennant
Signal strength 4 of 5
#NTDOY H1: Bearish pennant
The Bearish pennant pattern has formed on the #NTDOY H1 chart. It signals potential continuation of the existing trend. Specifications: the pattern’s bottom has the coordinate of 13.16; the projection of the flagpole height is equal to 49 pips. In case the price breaks out the pattern’s bottom of 13.16, the downtrend is expected to continue for further level 12.76. *此处发布的市场分析旨在提高您的意识,但不提供交易指示