 中文
中文 
 Русский
 English
 Bahasa Indonesia
 Bahasa Malay
 ไทย
ไทย Español
 Deutsch
 Български
 Français
 Tiếng Việt
 বাংলা
বাংলা हिन्दी
 Čeština
 Українська
 Română

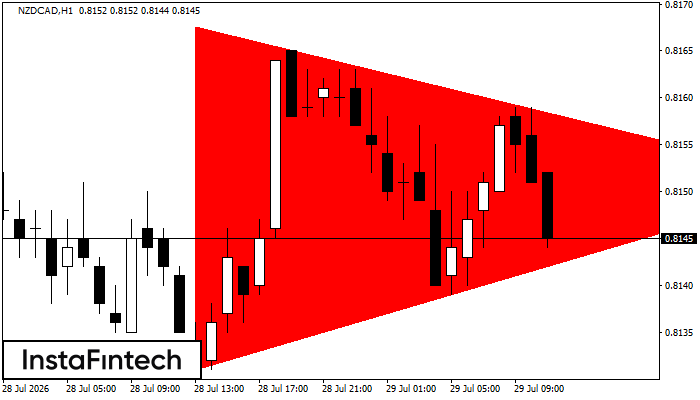 According to the chart of H1, NZDCAD formed the Bearish Symmetrical Triangle pattern. This pattern signals a further downward trend in case the lower border 0.8131 is breached. Here, a hypothetical profit will equal the width of the available pattern that is -37 pips.
 FX.co ★ NZDCAD H1: Bearish Symmetrical Triangle
Signal strength 4 of 5
NZDCAD H1: Bearish Symmetrical Triangle
According to the chart of H1, NZDCAD formed the Bearish Symmetrical Triangle pattern. This pattern signals a further downward trend in case the lower border 0.8131 is breached. Here, a hypothetical profit will equal the width of the available pattern that is -37 pips. *此处发布的市场分析旨在提高您的意识,但不提供交易指示