 中文
中文 
 Русский
 English
 Bahasa Indonesia
 Bahasa Malay
 ไทย
ไทย Español
 Deutsch
 Български
 Français
 Tiếng Việt
 বাংলা
বাংলা हिन्दी
 Čeština
 Українська
 Română

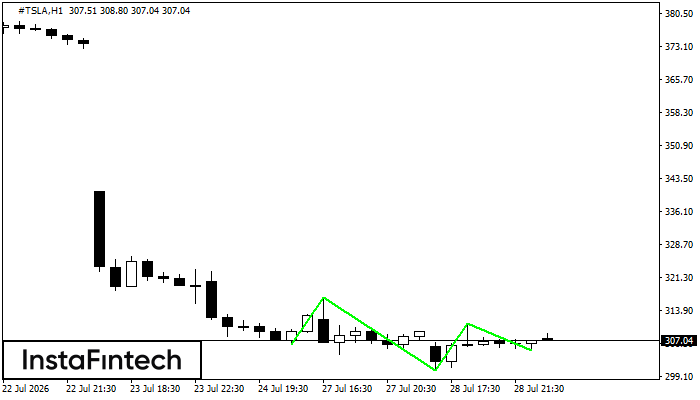 The Triple Bottom pattern has formed on the chart of the #TSLA H1 trading instrument. The pattern signals a change in the trend from downwards to upwards in the case of breakdown of 316.67/310.85.
 FX.co ★ #TSLA H1: Triple Bottom
Signal strength 4 of 5
#TSLA H1: Triple Bottom
The Triple Bottom pattern has formed on the chart of the #TSLA H1 trading instrument. The pattern signals a change in the trend from downwards to upwards in the case of breakdown of 316.67/310.85. *此处发布的市场分析旨在提高您的意识,但不提供交易指示