 中文
中文 
 Русский
 English
 Bahasa Indonesia
 Bahasa Malay
 ไทย
ไทย Español
 Deutsch
 Български
 Français
 Tiếng Việt
 বাংলা
বাংলা हिन्दी
 Čeština
 Українська
 Română

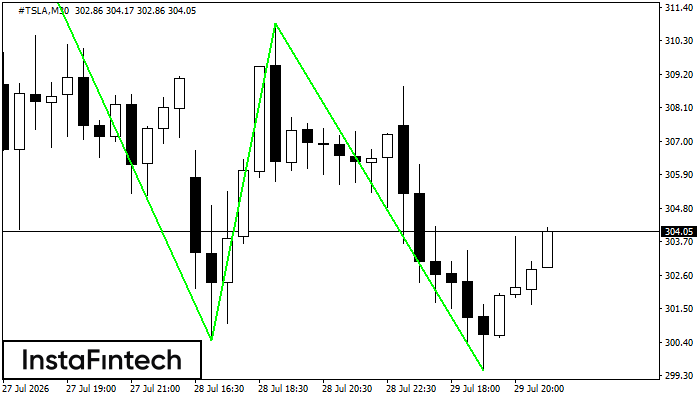 The Triple Bottom pattern has formed on the chart of #TSLA M30. Features of the pattern: The lower line of the pattern has coordinates 316.67 with the upper limit 316.67/310.85, the projection of the width is 1038 points. The formation of the Triple Bottom pattern most likely indicates a change in the trend from downward to upward. This means that in the event of a breakdown of the resistance level 306.29, the price is most likely to continue the upward movement.
 FX.co ★ #TSLA M30: Triple Bottom
Signal strength 3 of 5
#TSLA M30: Triple Bottom
The Triple Bottom pattern has formed on the chart of #TSLA M30. Features of the pattern: The lower line of the pattern has coordinates 316.67 with the upper limit 316.67/310.85, the projection of the width is 1038 points. The formation of the Triple Bottom pattern most likely indicates a change in the trend from downward to upward. This means that in the event of a breakdown of the resistance level 306.29, the price is most likely to continue the upward movement. *此处发布的市场分析旨在提高您的意识,但不提供交易指示