 中文
中文  Русский
 English
 Bahasa Indonesia
 Bahasa Malay
 ไทย
ไทย Español
 Deutsch
 Български
 Français
 Tiếng Việt
 বাংলা
বাংলা हिन्दी
 Čeština
 Українська
 Română
 According to the chart of M5, USDJPY formed the Bullish Symmetrical Triangle pattern. Description: This is the pattern of a trend continuation. 104.32 and 104.18 are the coordinates of the upper and lower borders respectively. The pattern width is measured on the chart at 14 pips. Outlook: If the upper border 104.32 is broken, the price is likely to continue its move by 104.40.
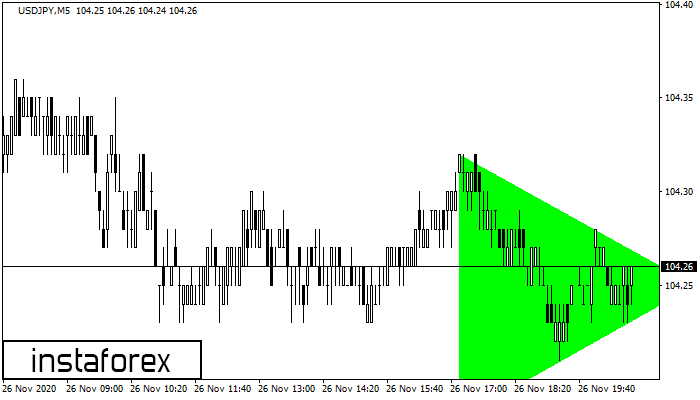
 The M5 and M15 time frames may have more false entry points.