 中文
中文 
 Русский
 English
 Bahasa Indonesia
 Bahasa Malay
 ไทย
ไทย Español
 Deutsch
 Български
 Français
 Tiếng Việt
 বাংলা
বাংলা हिन्दी
 Čeština
 Українська
 Română
FX.co ★ Actual patterns. Technical analysis and trading recommendations

技术分析模式
There is nothing more precious to a trader than an ability to predict a further price movement. Technical analysis is a key to your successful transaction. At the same time, you can rely on common and recurring situations that arise in the same circumstances. Our Technical Analysis Patterns section features all trading recommendations based on the technical analysis patterns that help traders make projections and turn a profit.
Instrument:
1 selected
#Bitcoin
EURCHF
EURGBP
EURJPY
EURUSD
EURCAD
EURRUB
EURNZD
USDCAD
USDCHF
USDJPY
USDRUB
NZDCAD
NZDUSD
NZDCHF
NZDJPY
AUDCAD
AUDCHF
AUDJPY
AUDUSD
GBPUSD
GBPJPY
GBPAUD
GBPCHF
GOLD
SILVER
#AAPL
#AMZN
#EBAY
#FB
#GOOG
#MCD
#MA
#KO
#INTC
#MSFT
#NTDOY
#PEP
#TSLA
#TWTR
Figure:
所有
三角形
矩形
三角旗形
旗形
头肩形态
双顶
三重顶
Timeframe:
所有
M5
M15
M30
H1
D1
Signal strength:
所有
High
Medium
Low
Signal direction:
所有
Buy
Sell
#KO
#KO M5
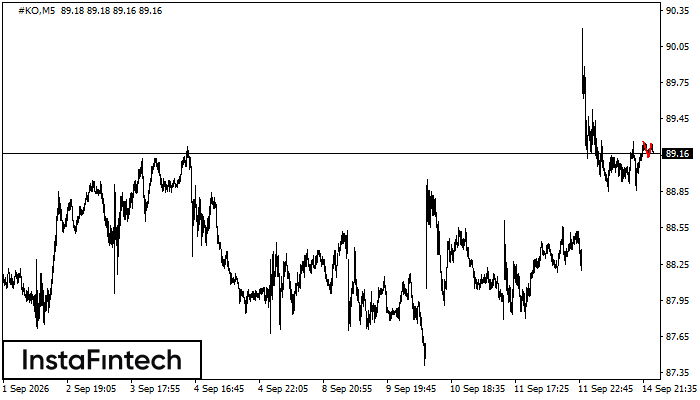
双顶
#KO在M5图表上形成了“双顶”形态,表明上涨趋势可能转为下跌。若跌破89.13形态底部,下跌走势可能延续。
#KO M5
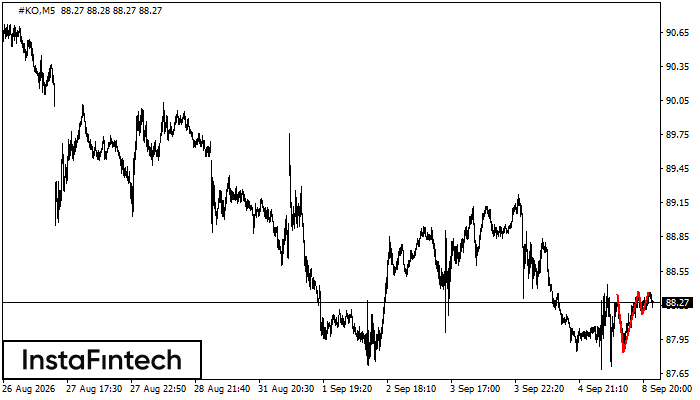
三重顶
#KO在M5图表上形成了“三重顶”反转形态。阻力位经过88.34/88.36,支撑位经过87.83/88.17,形态宽度为51点。若跌破位于87.83的确认支撑位,可能预示进一步下跌。
#KO M5
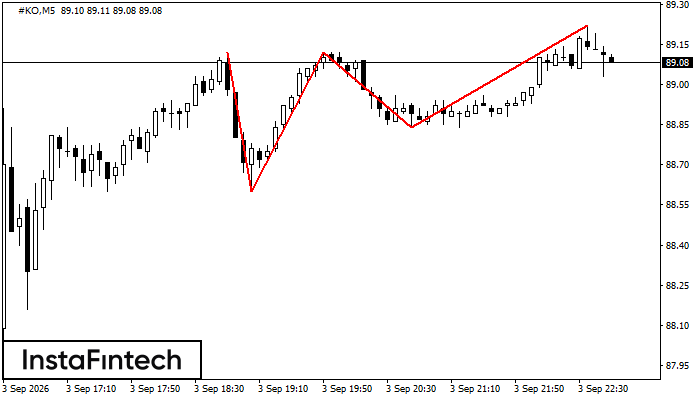
三重顶
#KO在M5图表上形成了“三重顶”反转形态。上边界经过89.12/89.22,下边界经过88.60/88.84,当前宽度为28点。若跌破位于88.60的确认支撑位,可用该宽度测算下跌空间。
#KO M30
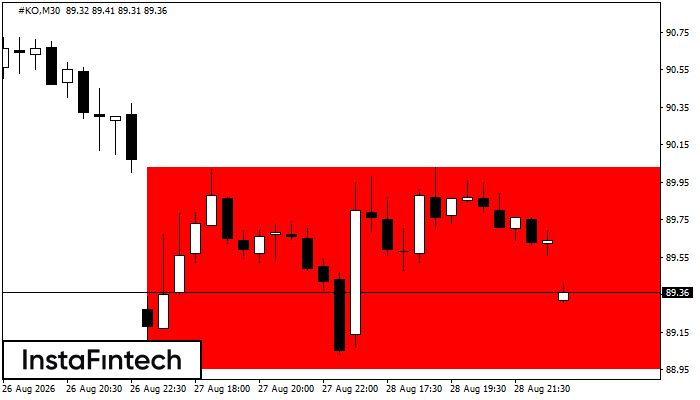
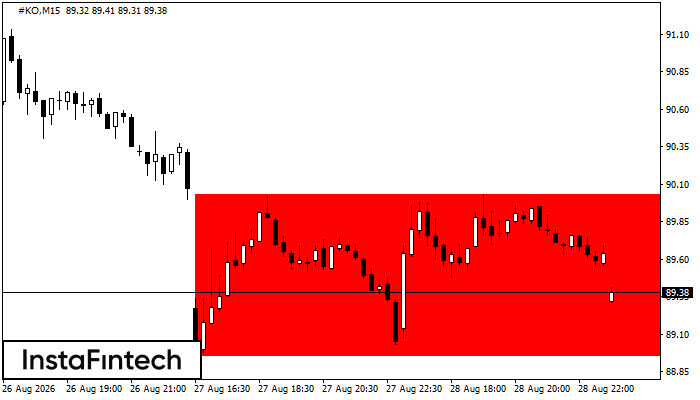
看跌矩形
#KO在M30图表上形成了趋势延续形态“看跌矩形”。下边界位于88.95–88.95,上边界位于90.03–90.03。若跌破下边界,下跌走势可能延续。
#KO M15
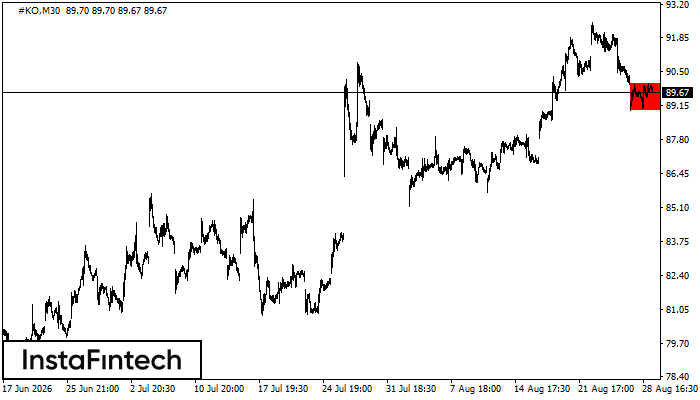
看跌矩形
#KO在M15图表上形成了“看跌矩形”形态,表明趋势可能延续。阻力区位于90.03–90.03,支撑区位于88.95–88.95。若跌破88.95支撑位,下跌趋势可能延续。
#KO M30
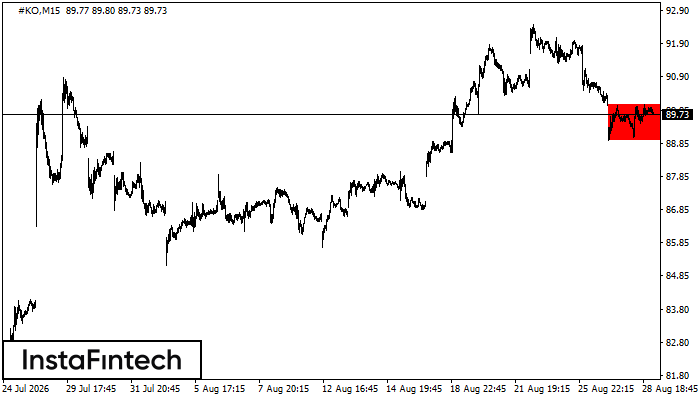
看跌矩形
#KO在M30图表上形成了趋势延续形态“看跌矩形”。下边界位于88.95–88.95,上边界位于90.03–90.03。若跌破下边界,下跌走势可能延续。
#KO M15
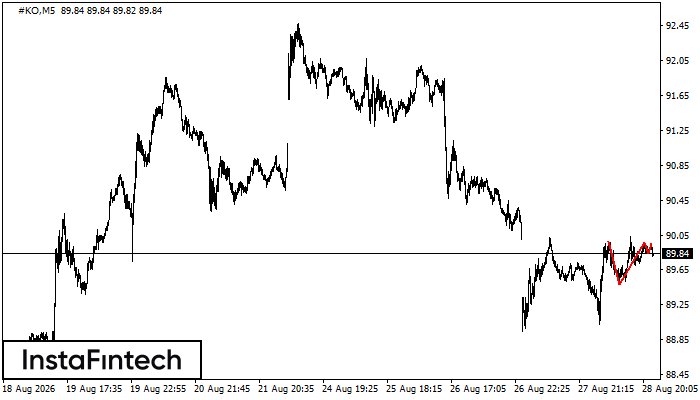
看跌矩形
#KO在M15图表上形成了趋势延续形态“看跌矩形”。下边界位于88.95–88.95,上边界位于90.03–90.03。若跌破下边界,下跌走势可能延续。
#KO M5
三重顶
#KO在M5图表上形成了“三重顶”形态,表明趋势可能反转。第三个峰值形成后,若跌破位于89.48的确认支撑位,可能确认看跌情景。峰值至低谷的预计距离为12点。
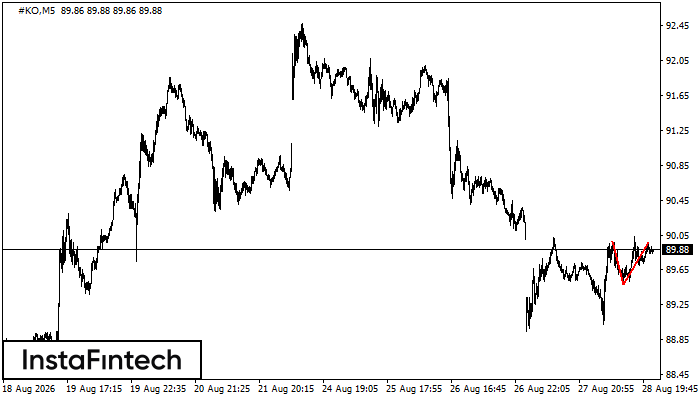
#KO M5
双顶
#KO在M5图表上形成了“双顶”反转形态。上边界为89.96,下边界为89.48,形态宽度为48点。跌破下边界可能推动价格继续向89.33下跌。
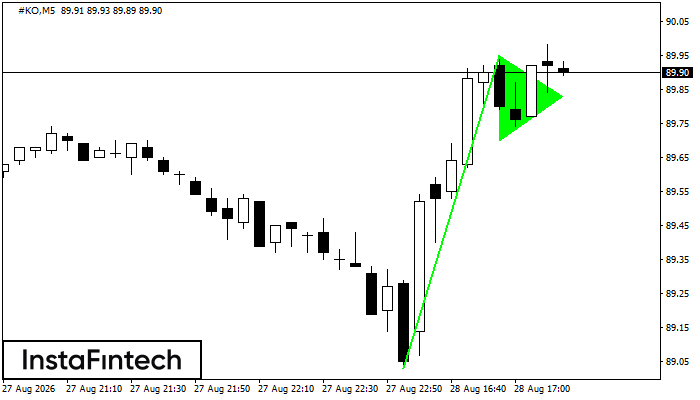
#KO M5
看涨三角旗形
#KO在M5图表上形成了“看涨三角旗形”趋势延续形态。若价格突破89.95形态高点,上涨趋势可能延续至90.10。