 Français
  Русский
 English
 Bahasa Indonesia
 Bahasa Malay
 ไทย
ไทย Español
 Deutsch
 Български
 Tiếng Việt
 中文
中文 বাংলা
বাংলা हिन्दी
 Čeština
 Українська
 Română
FX.co ★ Patterns #TSLA | Tesla, Inc. Stock Price


#TSLA M5
Triple Bottom
The Triple Bottom pattern has formed on the chart of #TSLA M5. Features of the pattern: The lower line of the pattern has coordinates 312.32 with the upper limit 312.32/311.71, the projection of the width is 405 points. The formation of the Triple Bottom pattern most likely indicates a change in the trend from downward to upward. This means that in the event of a breakdown of the resistance level 308.27, the price is most likely to continue the upward movement.

#TSLA M5
Triple Bottom
The Triple Bottom pattern has formed on the chart of the #TSLA M5 trading instrument. The pattern signals a change in the trend from downwards to upwards in the case of breakdown of 326.08/321.88.

#TSLA D1
Bearish Symmetrical Triangle
According to the chart of D1, #TSLA formed the Bearish Symmetrical Triangle pattern. This pattern signals a further downward trend in case the lower border 337.01 is breached. Here, a hypothetical profit will equal the width of the available pattern that is -13232 pips.
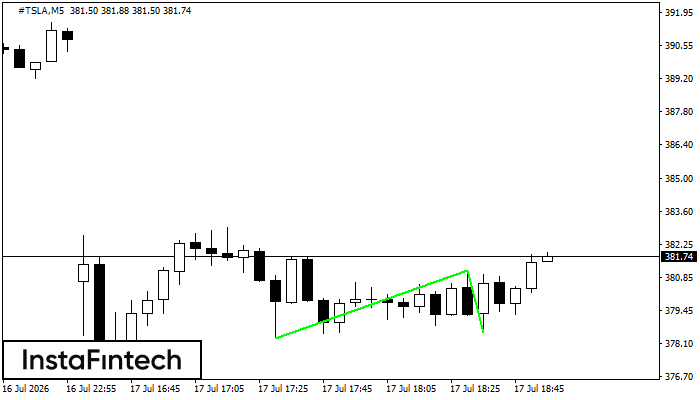
#TSLA M5
Double Bottom
The Double Bottom pattern has been formed on #TSLA M5; the upper boundary is 381.15; the lower boundary is 378.56. The width of the pattern is 285 points. In case of a break of the upper boundary 381.15, a change in the trend can be predicted where the width of the pattern will coincide with the distance to a possible take profit level.
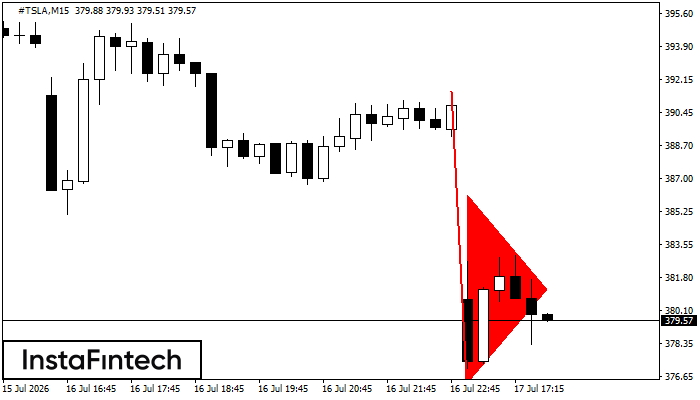
#TSLA M15
Bearish pennant
The Bearish pennant pattern has formed on the #TSLA M15 chart. The pattern signals continuation of the downtrend in case the pennant’s low of 376.24 is broken through. Recommendations: Place the sell stop pending order 10 pips below the pattern’s low. Place the take profit order at the projection distance of the flagpole height.
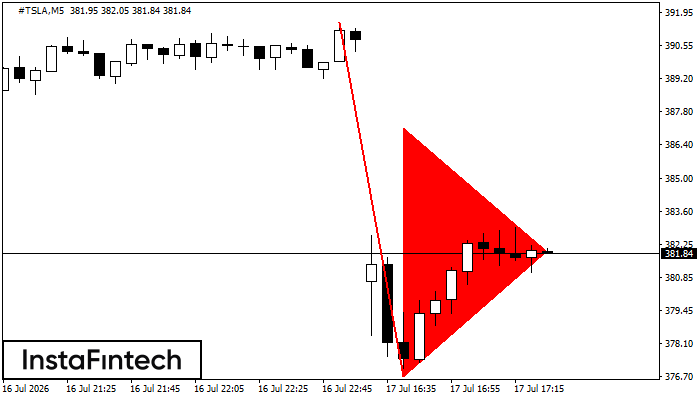
#TSLA M5
Bearish pennant
The Bearish pennant pattern has formed on the #TSLA M5 chart. The pattern signals continuation of the downtrend in case the pennant’s low of 376.70 is broken through. Recommendations: Place the sell stop pending order 10 pips below the pattern’s low. Place the take profit order at the projection distance of the flagpole height.
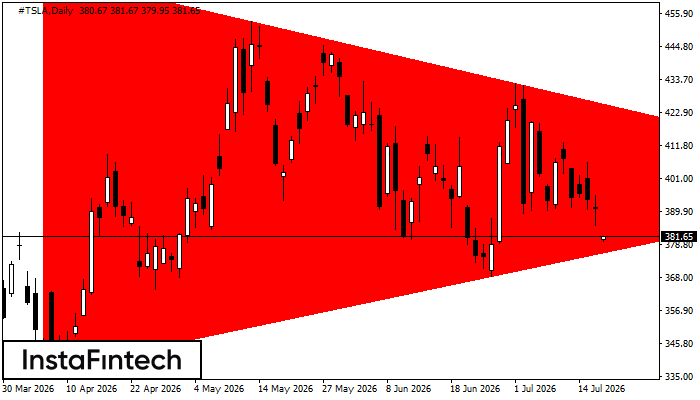
#TSLA D1
Bearish Symmetrical Triangle
According to the chart of D1, #TSLA formed the Bearish Symmetrical Triangle pattern. Description: The lower border is 337.01/399.66 and upper border is 469.33/399.66. The pattern width is measured on the chart at -13232 pips. The formation of the Bearish Symmetrical Triangle pattern evidently signals a continuation of the downward trend. In other words, if the scenario comes true and #TSLA breaches the lower border, the price could continue its move toward 399.26.
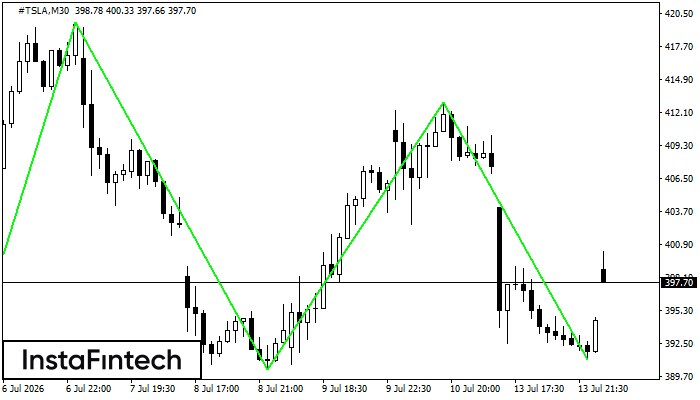
#TSLA M30
Triple Bottom
The Triple Bottom pattern has been formed on #TSLA M30. It has the following characteristics: resistance level 419.73/412.91; support level 389.08/391.14; the width is 3065 points. In the event of a breakdown of the resistance level of 419.73, the price is likely to continue an upward movement at least to 390.57.
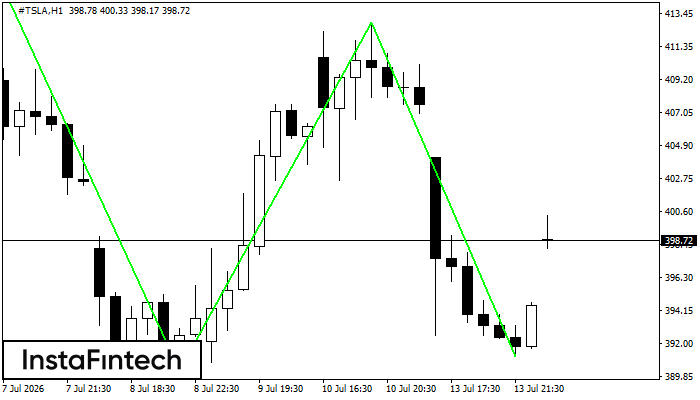
#TSLA H1
Triple Bottom
The Triple Bottom pattern has formed on the chart of #TSLA H1. Features of the pattern: The lower line of the pattern has coordinates 419.73 with the upper limit 419.73/412.91, the projection of the width is 3065 points. The formation of the Triple Bottom pattern most likely indicates a change in the trend from downward to upward. This means that in the event of a breakdown of the resistance level 389.08, the price is most likely to continue the upward movement.
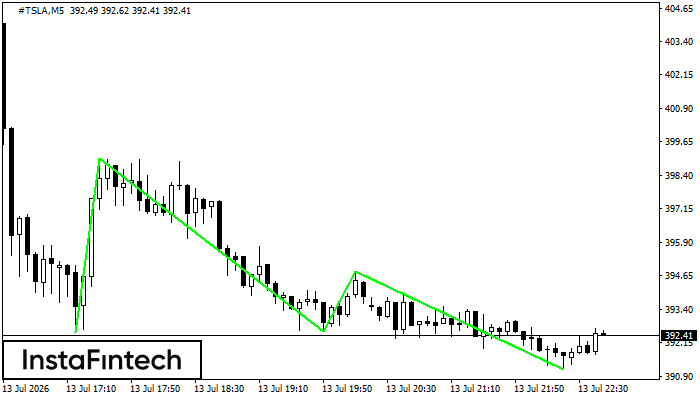
#TSLA M5
Triple Bottom
The Triple Bottom pattern has been formed on #TSLA M5. It has the following characteristics: resistance level 399.03/394.81; support level 392.54/391.14; the width is 649 points. In the event of a breakdown of the resistance level of 399.03, the price is likely to continue an upward movement at least to 392.71.