 中文
中文  Русский
 English
 Bahasa Indonesia
 Bahasa Malay
 ไทย
ไทย Español
 Deutsch
 Български
 Français
 Tiếng Việt
 বাংলা
বাংলা हिन्दी
 Čeština
 Українська
 Română
FX.co ★ Patterns EURCHF | Euro (EUR) to Swiss Franc (CHF) Rate in the Forex market


EURCHF M5
Head and Shoulders
According to the chart of M5, EURCHF formed the Head and Shoulders pattern. The Head’s top is set at 0.9320 while the median line of the Neck is found at 0.9313/0.9313. The formation of the Head and Shoulders pattern evidently signals a reversal of the upward trend. In other words, in case the scenario comes true, the price of EURCHF will go towards 0.9298.

EURCHF M30
Triple Top
The Triple Top pattern has formed on the chart of the EURCHF M30 trading instrument. It is a reversal pattern featuring the following characteristics: resistance level 0, support level -8, and pattern’s width 12. Forecast If the price breaks through the support level 0.9302, it is likely to move further down to 0.9286.

EURCHF M15
Triple Top
On the chart of the EURCHF M15 trading instrument, the Triple Top pattern that signals a trend change has formed. It is possible that after formation of the third peak, the price will try to break through the resistance level 0.9302, where we advise to open a trading position for sale. Take profit is the projection of the pattern’s width, which is 12 points.
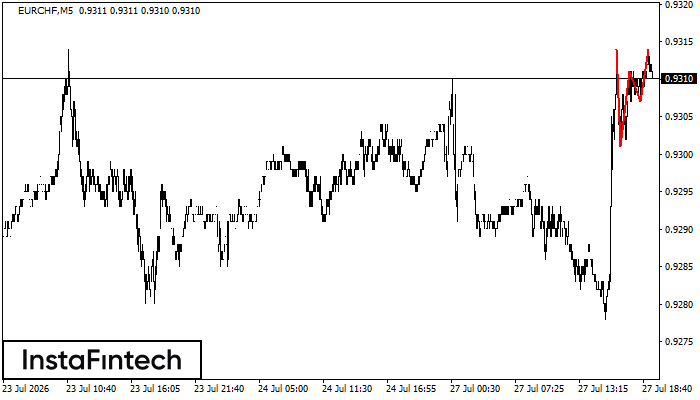
EURCHF M5
Triple Top
On the chart of the EURCHF M5 trading instrument, the Triple Top pattern that signals a trend change has formed. It is possible that after formation of the third peak, the price will try to break through the resistance level 0.9301, where we advise to open a trading position for sale. Take profit is the projection of the pattern’s width, which is 13 points.

EURCHF M5
Double Bottom
The Double Bottom pattern has been formed on EURCHF M5; the upper boundary is 0.9292; the lower boundary is 0.9289. The width of the pattern is 3 points. In case of a break of the upper boundary 0.9292, a change in the trend can be predicted where the width of the pattern will coincide with the distance to a possible take profit level.

EURCHF M15
Bearish Flag
The Bearish Flag pattern has been formed on EURCHF at M15. The lower boundary of the pattern is located at 0.9289/0.9291 while the upper boundary lies at 0.9293/0.9295. The projection of the flagpole is 12 points. This formation signals that the downward trend is most likely to continue. Therefore, if the level of 0.9289 is broken, the price will move further downwards.

EURCHF M15
Bearish pennant
The Bearish pennant pattern has formed on the EURCHF M15 chart. This pattern type is characterized by a slight slowdown after which the price will move in the direction of the original trend. In case the price fixes below the pattern’s low of 0.9289, a trader will be able to successfully enter the sell position.

EURCHF M5
Bearish Symmetrical Triangle
According to the chart of M5, EURCHF formed the Bearish Symmetrical Triangle pattern. Trading recommendations: A breach of the lower border 0.9291 is likely to encourage a continuation of the downward trend.

EURCHF M15
Double Top
On the chart of EURCHF M15 the Double Top reversal pattern has been formed. Characteristics: the upper boundary 0.9269; the lower boundary 0.9263; the width of the pattern 6 points. The signal: a break of the lower boundary will cause continuation of the downward trend targeting the 0.9240 level.

EURCHF M30
Double Top
The Double Top pattern has been formed on EURCHF M30. It signals that the trend has been changed from upwards to downwards. Probably, if the base of the pattern 0.9226 is broken, the downward movement will continue.