FX.co ★ Patterns #FB | Facebook, Inc. Stock Price

#FB M15
Double Bottom
The Double Bottom pattern has been formed on #FB M15. This formation signals a reversal of the trend from downwards to upwards. The signal is that a buy trade should be opened after the upper boundary of the pattern 597.97 is broken. The further movements will rely on the width of the current pattern 447 points.
#FB H1
Double Bottom
The Double Bottom pattern has been formed on #FB H1. This formation signals a reversal of the trend from downwards to upwards. The signal is that a buy trade should be opened after the upper boundary of the pattern 610.94 is broken. The further movements will rely on the width of the current pattern 1637 points.
#FB M5
Triple Bottom
The Triple Bottom pattern has formed on the chart of #FB M5. Features of the pattern: The lower line of the pattern has coordinates 604.09 with the upper limit 604.09/602.85, the projection of the width is 397 points. The formation of the Triple Bottom pattern most likely indicates a change in the trend from downward to upward. This means that in the event of a breakdown of the resistance level 600.12, the price is most likely to continue the upward movement.
#FB M5
Bearish pennant
The Bearish pennant pattern has formed on the #FB M5 chart. This pattern type is characterized by a slight slowdown after which the price will move in the direction of the original trend. In case the price fixes below the pattern’s low of 636.67, a trader will be able to successfully enter the sell position.
#FB M5
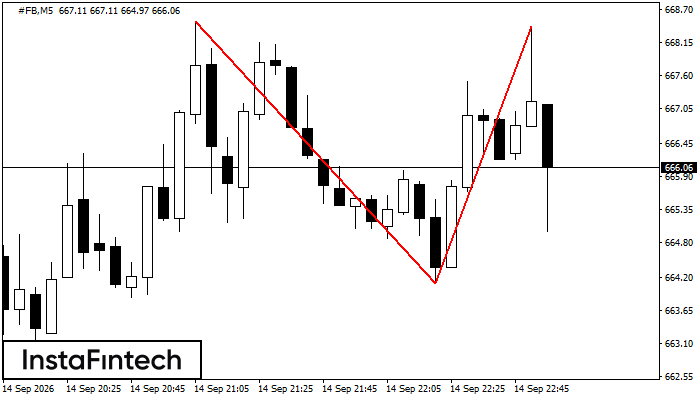
Triple Top
The Triple Top pattern has formed on the chart of the #FB M5. Features of the pattern: borders have an ascending angle; the lower line of the pattern has the coordinates 655.61/660.26 with the upper limit 662.64/663.44; the projection of the width is 703 points. The formation of the Triple Top figure most likely indicates a change in the trend from upward to downward. This means that in the event of a breakdown of the support level of 655.61, the price is most likely to continue the downward movement.
#FB M30
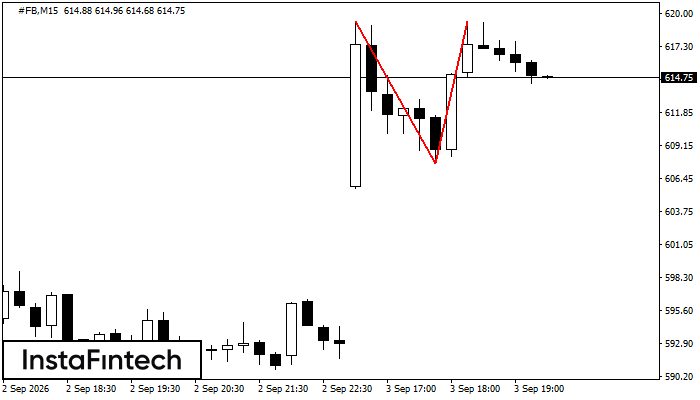
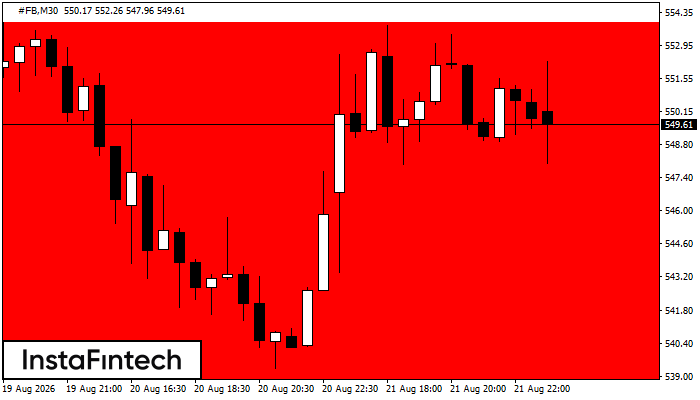
Double Top
The Double Top pattern has been formed on #FB M30. It signals that the trend has been changed from upwards to downwards. Probably, if the base of the pattern 662.00 is broken, the downward movement will continue.
#FB M5
Bullish Symmetrical Triangle
According to the chart of M5, #FB formed the Bullish Symmetrical Triangle pattern. The lower border of the pattern touches the coordinates 661.37/670.53 whereas the upper border goes across 677.78/670.53. If the Bullish Symmetrical Triangle pattern is in progress, this evidently signals a further upward trend. In other words, in case the scenario comes true, the price of #FB will breach the upper border to head for 670.68.
#FB M5
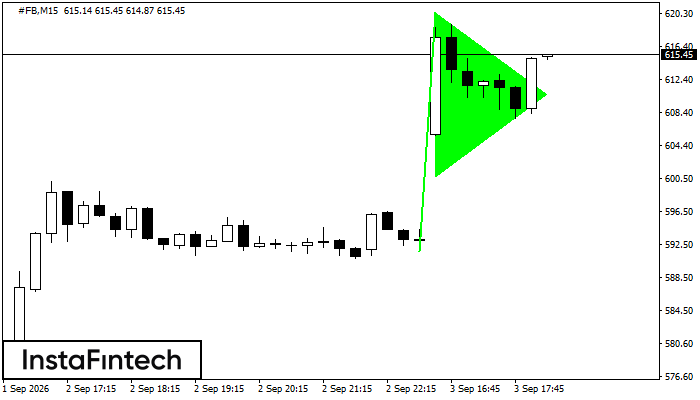
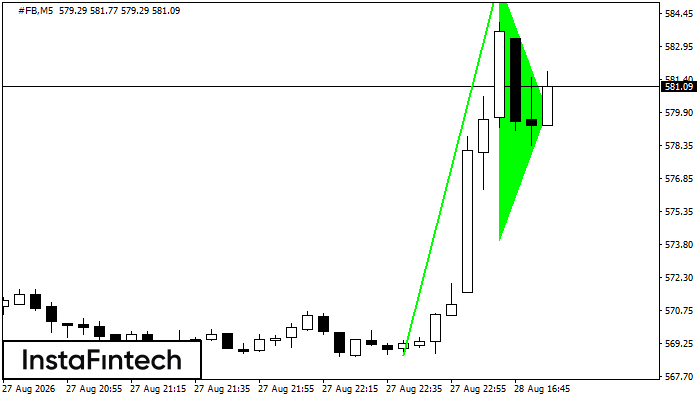
Bullish pennant
The Bullish pennant graphic pattern has formed on the #FB M5 instrument. This pattern type falls under the category of continuation patterns. In this case, if the quote can breaks out high, is expected to continue the upward trend to level 679.19.
#FB M30
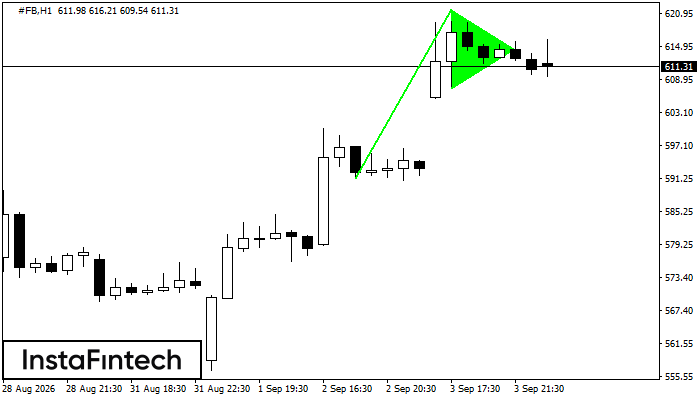
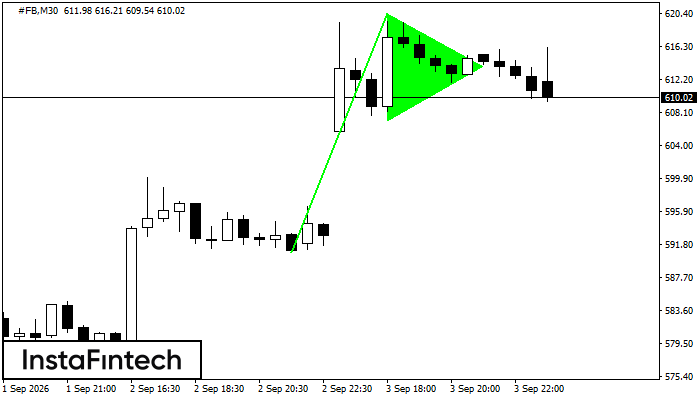
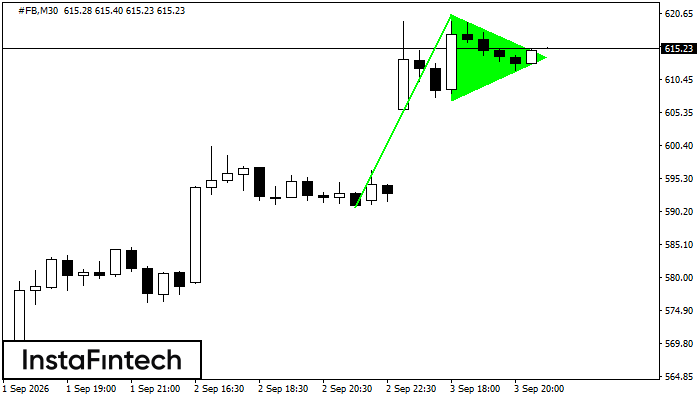
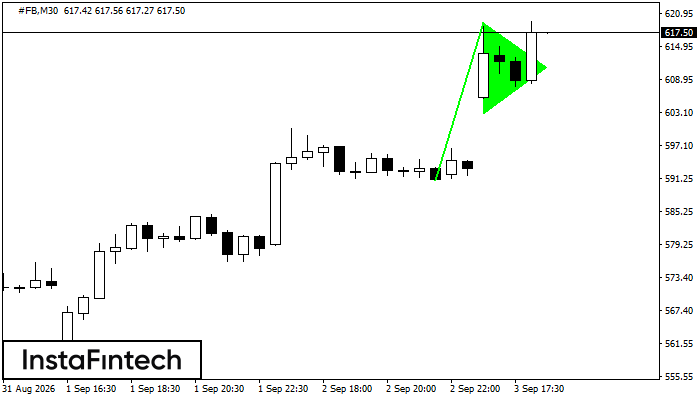
Bullish pennant
The Bullish pennant signal – Trading instrument #FB M30, continuation pattern. Forecast: it is possible to set up a buy position above the pattern’s high of 630.81, with the prospect of the next move being a projection of the flagpole height.
#FB M5
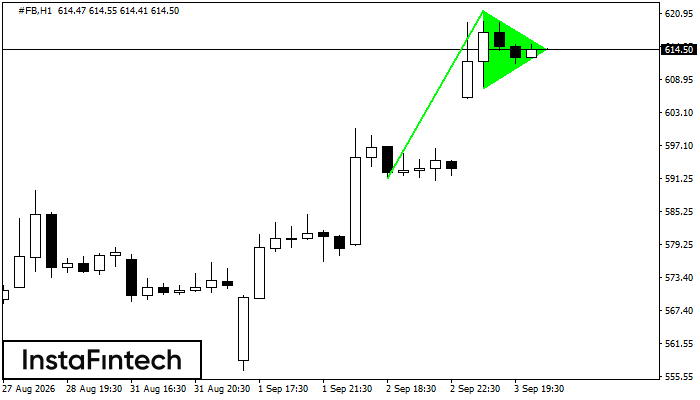
Bullish pennant
The Bullish pennant graphic pattern has formed on the #FB M5 instrument. This pattern type falls under the category of continuation patterns. In this case, if the quote can breaks out high, is expected to continue the upward trend to level 610.46.