 中文
中文  Русский
 English
 Bahasa Indonesia
 Bahasa Malay
 ไทย
ไทย Español
 Deutsch
 Български
 Français
 Tiếng Việt
 বাংলা
বাংলা हिन्दी
 Čeština
 Українська
 Română
FX.co ★ Patterns #PEP | PepsiCo, Inc. Stock Price


#PEP M5
Bullish Rectangle
According to the chart of M5, #PEP formed the Bullish Rectangle which is a pattern of a trend continuation. The pattern is contained within the following borders: the lower border 143.95 – 143.95 and upper border 145.22 – 145.22. In case the upper border is broken, the instrument is likely to follow the upward trend.

#PEP M30
Double Top
The Double Top reversal pattern has been formed on #PEP M30. Characteristics: the upper boundary 145.40; the lower boundary 141.77; the width of the pattern is 345 points. Sell trades are better to be opened below the lower boundary 141.77 with a possible movements towards the 141.47 level.

#PEP M15
Double Top
The Double Top pattern has been formed on #PEP M15. It signals that the trend has been changed from upwards to downwards. Probably, if the base of the pattern 143.95 is broken, the downward movement will continue.
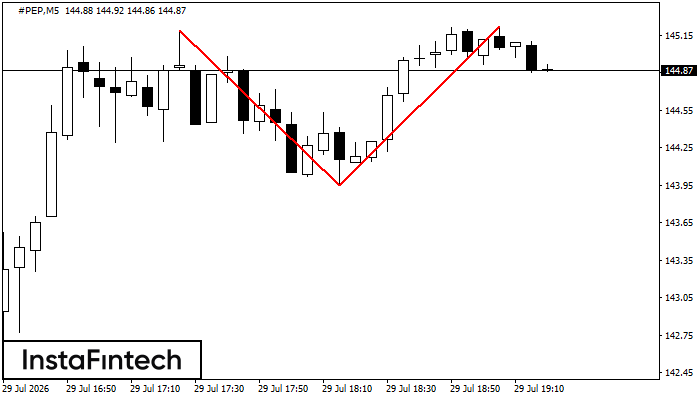
#PEP M5
Double Top
On the chart of #PEP M5 the Double Top reversal pattern has been formed. Characteristics: the upper boundary 145.22; the lower boundary 143.95; the width of the pattern 127 points. The signal: a break of the lower boundary will cause continuation of the downward trend targeting the 143.80 level.

#PEP M15
Bullish pennant
The Bullish pennant pattern is formed on the #PEP M15 chart. It is a type of the continuation pattern. Supposedly, in case the price is fixed above the pennant’s high of 145.23, a further uptrend is possible.

#PEP M5
Bullish pennant
The Bullish pennant pattern is formed on the #PEP M5 chart. It is a type of the continuation pattern. Supposedly, in case the price is fixed above the pennant’s high of 145.30, a further uptrend is possible.

#PEP M15
Double Top
The Double Top pattern has been formed on #PEP M15. It signals that the trend has been changed from upwards to downwards. Probably, if the base of the pattern 139.27 is broken, the downward movement will continue.

#PEP M15
Bullish pennant
The Bullish pennant signal – Trading instrument #PEP M15, continuation pattern. Forecast: it is possible to set up a buy position above the pattern’s high of 140.99, with the prospect of the next move being a projection of the flagpole height.

#PEP M5
Bullish pennant
The Bullish pennant graphic pattern has formed on the #PEP M5 instrument. This pattern type falls under the category of continuation patterns. In this case, if the quote can breaks out high, is expected to continue the upward trend to level 138.62.

#PEP M5
Double Top
The Double Top pattern has been formed on #PEP M5. It signals that the trend has been changed from upwards to downwards. Probably, if the base of the pattern 136.53 is broken, the downward movement will continue.