logo

FX.co ★ Patterns SILVER | Silver Rate in the Forex market

SILVER M5

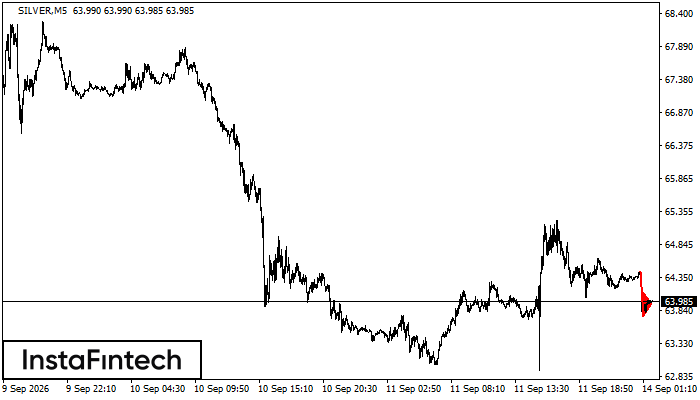
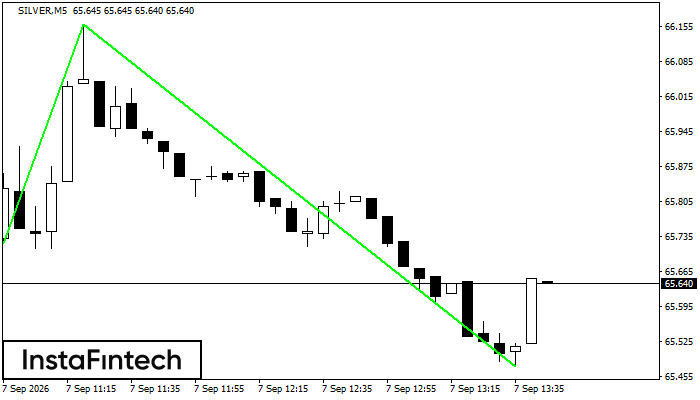
Triple Bottom
The Triple Bottom pattern has formed on the chart of SILVER M5. Features of the pattern: The lower line of the pattern has coordinates 57.44 with the upper limit 57.44/57.19, the projection of the width is 630 points. The formation of the Triple Bottom pattern most likely indicates a change in the trend from downward to upward. This means that in the event of a breakdown of the resistance level 56.81, the price is most likely to continue the upward movement.
2026-07-29

SILVER M5

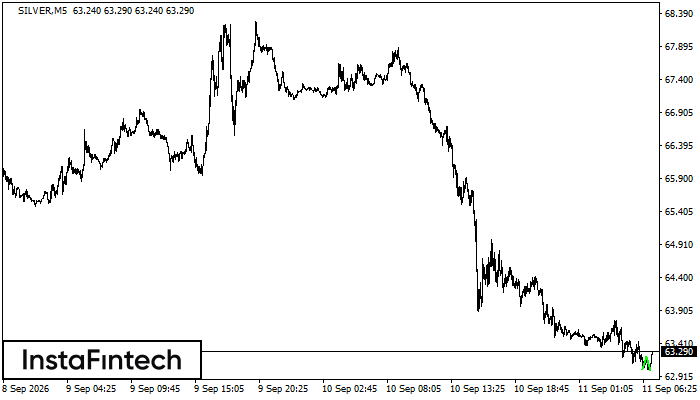
Double Bottom
The Double Bottom pattern has been formed on SILVER M5. This formation signals a reversal of the trend from downwards to upwards. The signal is that a buy trade should be opened after the upper boundary of the pattern 57.44 is broken. The further movements will rely on the width of the current pattern 630 points.
2026-07-29

SILVER H1

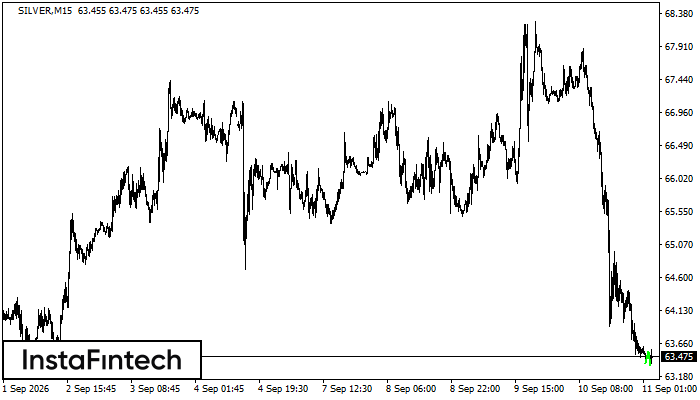
Triple Bottom
The Triple Bottom pattern has been formed on SILVER H1. It has the following characteristics: resistance level 57.63/57.49; support level 56.69/56.84; the width is 950 points. In the event of a breakdown of the resistance level of 57.63, the price is likely to continue an upward movement at least to 56.66.
2026-07-29

SILVER M30

Triple Bottom
The Triple Bottom pattern has formed on the chart of SILVER M30. Features of the pattern: The lower line of the pattern has coordinates 57.63 with the upper limit 57.63/57.49, the projection of the width is 950 points. The formation of the Triple Bottom pattern most likely indicates a change in the trend from downward to upward. This means that in the event of a breakdown of the resistance level 56.69, the price is most likely to continue the upward movement.
2026-07-29

SILVER M30

Bearish Rectangle
According to the chart of M30, SILVER formed the Bearish Rectangle which is a pattern of a trend continuation. The pattern is contained within the following borders: lower border 56.62 – 56.62 and upper border 57.63 – 57.63. In case the lower border is broken, the instrument is likely to follow the downward trend.
2026-07-28

SILVER H1

Bearish Rectangle
According to the chart of H1, SILVER formed the Bearish Rectangle. This type of a pattern indicates a trend continuation. It consists of two levels: resistance 57.63 - 0.00 and support 56.62 – 56.62. In case the resistance level 56.62 - 56.62 is broken, the instrument is likely to follow the bearish trend.
2026-07-28

SILVER H1

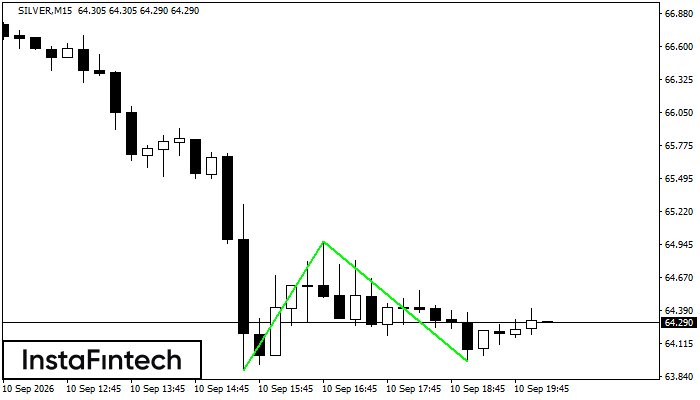
Double Bottom
The Double Bottom pattern has been formed on SILVER H1; the upper boundary is 57.63; the lower boundary is 56.62. The width of the pattern is 950 points. In case of a break of the upper boundary 57.63, a change in the trend can be predicted where the width of the pattern will coincide with the distance to a possible take profit level.
2026-07-28

SILVER M5

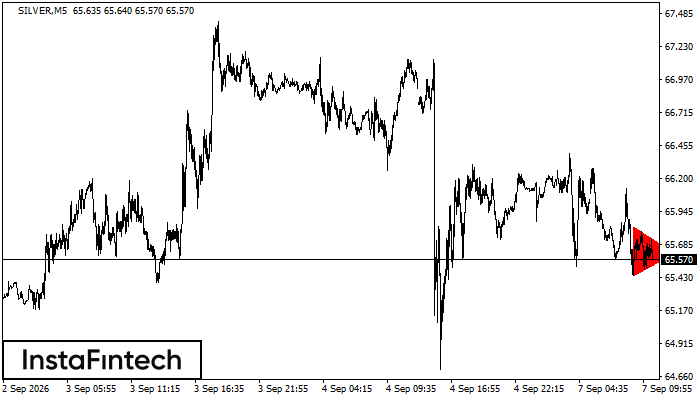
Bearish Symmetrical Triangle
According to the chart of M5, SILVER formed the Bearish Symmetrical Triangle pattern. Description: The lower border is 56.69/57.27 and upper border is 57.77/57.27. The pattern width is measured on the chart at -1082 pips. The formation of the Bearish Symmetrical Triangle pattern evidently signals a continuation of the downward trend. In other words, if the scenario comes true and SILVER breaches the lower border, the price could continue its move toward 57.25.
2026-07-28

SILVER M15

Bearish Symmetrical Triangle
According to the chart of M15, SILVER formed the Bearish Symmetrical Triangle pattern. Trading recommendations: A breach of the lower border 56.69 is likely to encourage a continuation of the downward trend.
2026-07-28

SILVER M5

Double Top
The Double Top pattern has been formed on SILVER M5. It signals that the trend has been changed from upwards to downwards. Probably, if the base of the pattern 57.32 is broken, the downward movement will continue.
2026-07-28