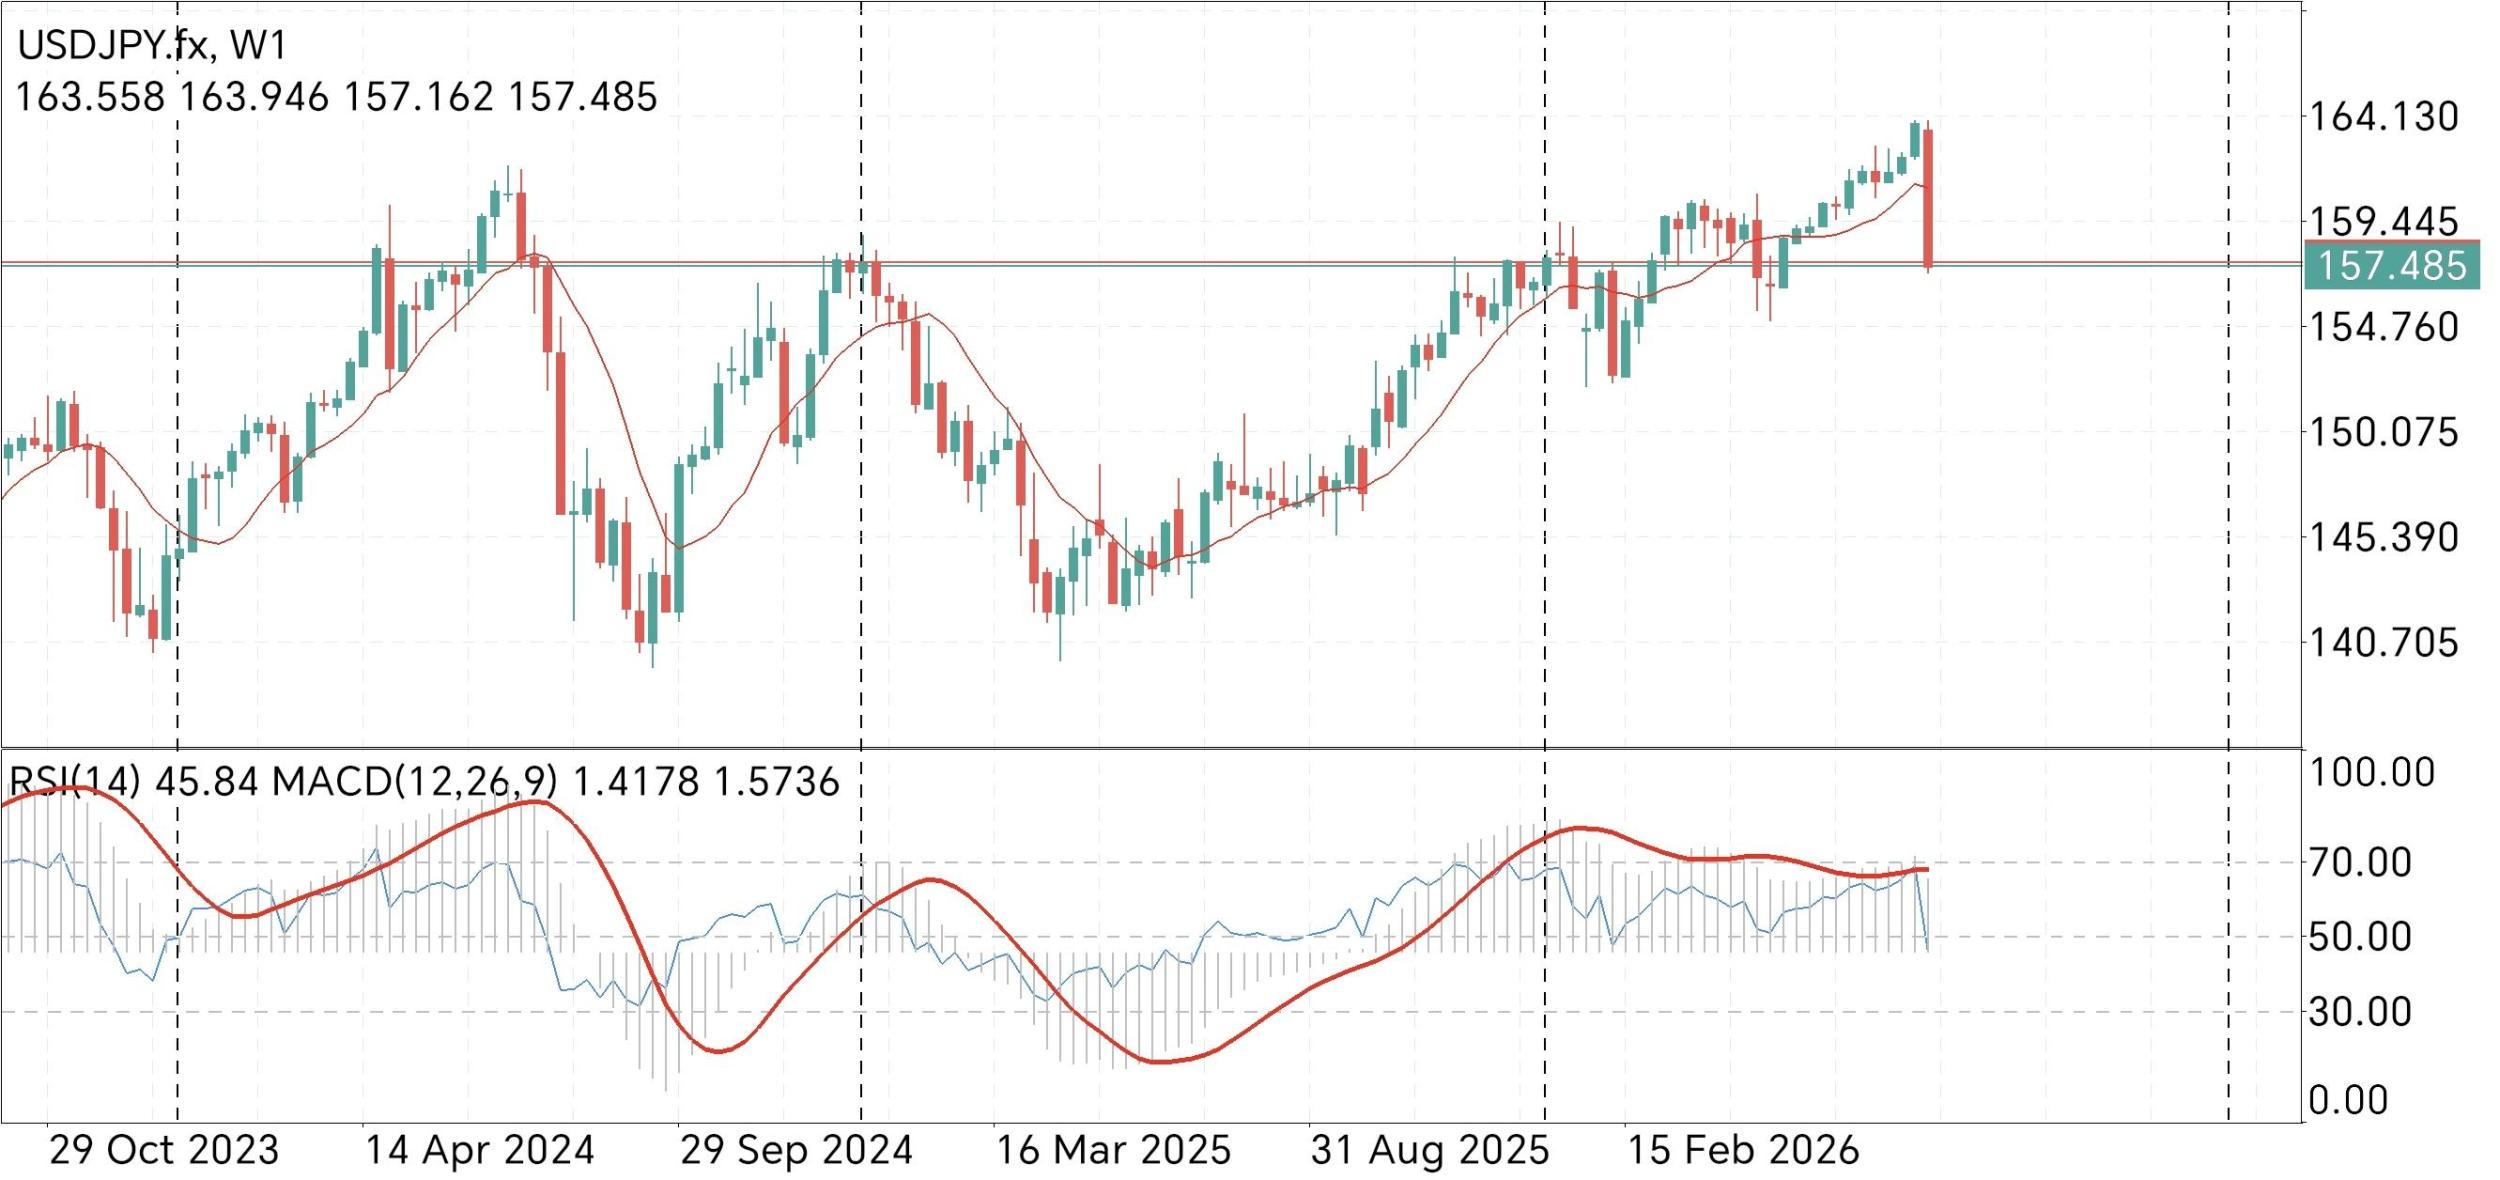
 Primary Trend & Market Structure
 On the weekly (W1) USDJPY chart, the broader trend remains bearish from the October 2023 peak (163.558) to the March 2025 trough (145.390), a decisive 11.1% decline. However, price action since late 2024 shows choppy consolidation—neither a clean impulse nor a clear reversal. The most recent close at 157.485 (15 Feb 2026) sits just above the 29 Sep 2024 same level, forming a potential double-bottom near 145.39–145.48, but this needs confirmation above 159.445 (31 Aug 2025). The structure is range-bound between 145.39 (major support) and 159.45–163.56 (resistance zone). The 100.00 “Value” column likely represents a normalized index, not pips, so focus on raw prices. Momentum is flat—no higher highs or lower lows since mid-2025—suggesting indecision ahead of BoJ and Fed policy shifts.
Key Levels & Chart Patterns · Nearest Major Support: 145.390 (16 Mar 2025 low) – a critical bullish line; a break below opens 140.00 psychological. · Nearest Major Resistance: 159.445 (31 Aug 2025 high) – then the 163.558 all-time high (Oct 2023) as the ultimate ceiling. · Visible Pattern: A developing symmetrical triangle or broadening wedge if you connect the lower highs (163.56 → 159.45 → 157.49) and higher lows (145.39 → 157.16 → 157.49). No classic double top or head-and-shoulders—the 157.16 and 157.49 lows are too close to form a reliable H&S. However, the rejection wicks near 157.16 (Apr 2024) and 157.49 (Sep 2024 & Feb 2026) hint at strong buying interest, making this a demand zone. The 31 Aug 2025 spike to 159.45 acted as a fakeout above the descending trendline, trapping bulls—a bearish sign if price fails to reclaim that level.
Bullish vs. Bearish Scenarios · Bullish Scenario (60% probability): A break and close above 159.445 on strong weekly volume would confirm the double-bottom and trigger a rally toward 163.558, then 167.00 (1.618 extension). Drivers: BoJ’s cautious rate hikes vs. Fed’s delayed cuts, widening US-Japan yield differentials, and risk-on flows into JPY shorts. Entry: Buy on a daily pullback to 157.00–157.50, stop below 145.39, target 163.50 (risk/reward ~1:3). Watch for US CPI and BoJ commentary—hawkish Fed or dovish BoJ fuel this move.
· Bearish Scenario (40% probability): A break below 145.390 would invalidate the base and accelerate selling toward 140.00 (2024 low) and 136.50 (2023 support). This requires a catalyst: BoJ intervening verbally to cap JPY weakness, or a US recession scare slashing Treasury yields. Entry: Sell on a close below 145.00, stop above 159.45, target 140.00 (R:R ~1:4). However, given the two rejections at 157.16/157.49, bears need fresh momentum—watch for a headline shock (e.g., Fed pivot or geopolitical risk).
Trade Setup & Summary Neutral bias until price breaks 145.39 or 159.45. For active traders:
· Bullish setup: Limit buy at 156.80 (near Feb 2026 close), SL 144.80, TP 163.00—risk 1200 pips for 620 pips reward (0.5:1), so scale position or wait for break above 159.45 for confirmation.
· Bearish setup: Sell stop at 144.80, SL 160.00, TP 140.00—risk 1520 pips for 480 pips (0.3:1), less attractive. Preferred approach: Stand aside until price clears the range. If 159.45 breaks, add longs with trailing stop; if 145.39 breaks, short with tight risk. Fundamentals: BoJ’s yield curve control exit and Fed’s terminal rate path are the real drivers—monitor US 10-year yields and Japan’s wage data. Current structure is a battle zone; patience beats prediction. The 100.00 “Value” column likely represents a relative strength index—ignore for price levels. In summary, USDJPY is at a multi-month inflection point; the next weekly close outside the 145–159 band will define Q3 2026 trend. Trade the breakout, not the noise.
*Die zur Verfügung gestellte Marktanalyse dient zu den Informationszwecken und sollte als Anforderung zur Eröffnung einer Transaktion nicht ausgelegt werden
 Deutsch
 Русский
 English
 Bahasa Indonesia
 Bahasa Malay
 ไทย
ไทย Español
 Български
 Français
 Tiếng Việt
 中文
中文 বাংলা
বাংলা हिन्दी
 Čeština
 Українська
 Română
