 Crude Oil (#CL) Weekly Timeframe Analysis 2 August 2026
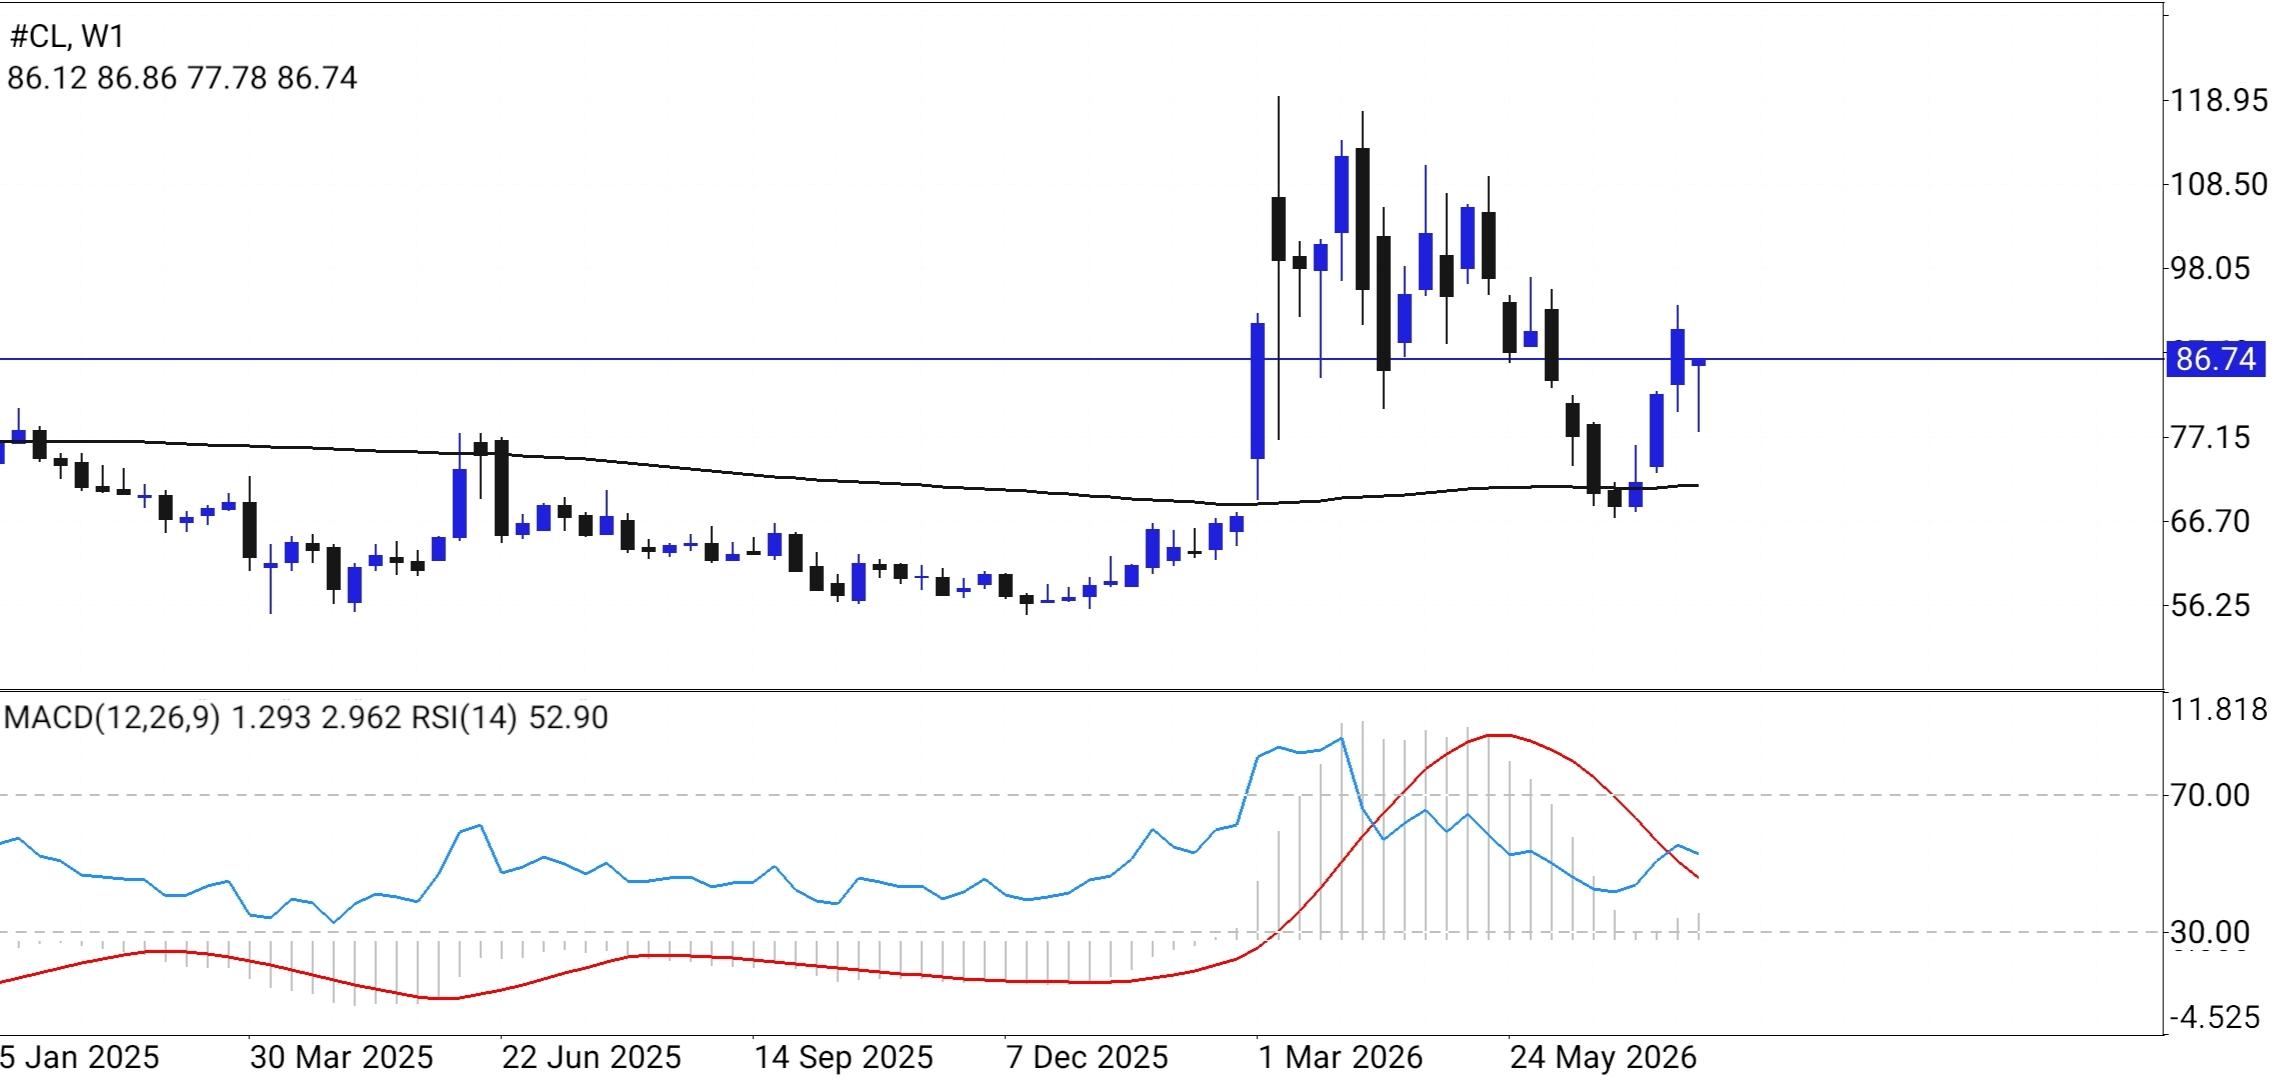
 A comprehensive technical examination of the WTI Crude Oil (CL, W1) weekly chart reveals a complex market structure defined by significant volatility shifts, moving average dynamics, and momentum indicator oscillations.
Price Action and Market Structure The weekly chart displays a pronounced structural shift following a protracted consolidation phase throughout 2025. Prices traded within a relatively subdued band below the major moving average threshold for several months, characterized by lower highs and established support floors near the $56.00 to $66.70 regions. A violent upward expansion materialized in early 2026, driving the commodity sharply higher past the psychological $100.00 threshold and peaking near the upper boundaries close to $118.95. Following this aggressive rally, the market experienced a sharp corrective wave, plunging back toward the medium-term moving average zone before attempting a recovery. Currently, the price is stabilizing around the 86.74 horizontal resistance-turned-pivot level. This area acts as a crucial battleground for market participants, determining whether the preceding bullish impulse can resume or if secondary distribution will take over.
Moving Average Dynamics The black trend line representing the medium-to-long-term moving average on the weekly timeframe illustrates a flat-to-mildly-ascending trajectory. During the 2025 consolidation, prices hovered tightly around this baseline. The explosive surge in early 2026 caused a dramatic upward separation, stretching the distance between the price action and the moving average. The subsequent retracement brought the market back down to test this dynamic baseline support. The ability of the moving average to flatten and absorb the downward pressure confirms that the broader multi-timeframe baseline remains intact, even as short-term corrective forces test market resolve.
Oscillator Analysis (MACD and RSI) The lower panel indicators offer further insight into underlying market momentum: • Relative Strength Index (RSI 14): Standing at 52.90, the RSI is positioned almost exactly at the equilibrium midpoint. This neutral reading reflects a balance of power between buyers and sellers following the exhaustion of the extreme overbought conditions registered during the early 2026 price spike. It suggests that the market is currently waiting for a directional catalyst to trigger the next major trend leg. • Moving Average Convergence Divergence (MACD): The MACD values display a reading of 1.293 for the histogram/fast components and 2.962 for the signal line configuration. While the positive values indicate that medium-term bullish momentum has not been entirely erased, the converging nature of the lines points toward a cooling phase and a reduction in trend velocity.
Outlook and Key Levels Going forward, market participants will closely monitor whether WTI crude can sustain acceptance above the 86.74 pivot marker. A sustained weekly close above this zone would re-establish bullish traction toward higher resistance barriers. Conversely, failure to hold this pivot could invite retests of lower moving average supports as the market continues to digest its macro-driven volatility.
*Die zur Verfügung gestellte Marktanalyse dient zu den Informationszwecken und sollte als Anforderung zur Eröffnung einer Transaktion nicht ausgelegt werden
 Deutsch
 Русский
 English
 Bahasa Indonesia
 Bahasa Malay
 ไทย
ไทย Español
 Български
 Français
 Tiếng Việt
 中文
中文 বাংলা
বাংলা हिन्दी
 Čeština
 Українська
 Română
