 English
  Русский
 Bahasa Indonesia
 Bahasa Malay
 ไทย
ไทย Español
 Deutsch
 Български
 Français
 Tiếng Việt
 中文
中文 বাংলা
বাংলা हिन्दी
 Čeština
 Українська
 Română
FX.co ★ Actual patterns. Technical analysis and trading recommendations

Technical Analysis Patterns
There is nothing more precious to a trader than an ability to predict a further price movement. Technical analysis is a key to your successful transaction. At the same time, you can rely on common and recurring situations that arise in the same circumstances. Our Technical Analysis Patterns section features all trading recommendations based on the technical analysis patterns that help traders make projections and turn a profit.
Instrument:
All
#Bitcoin
EURCHF
EURGBP
EURJPY
EURUSD
EURCAD
EURRUB
EURNZD
USDCAD
USDCHF
USDJPY
USDRUB
NZDCAD
NZDUSD
NZDCHF
NZDJPY
AUDCAD
AUDCHF
AUDJPY
AUDUSD
GBPUSD
GBPJPY
GBPAUD
GBPCHF
GOLD
SILVER
#AAPL
#AMZN
#EBAY
#FB
#GOOG
#MCD
#MA
#KO
#INTC
#MSFT
#NTDOY
#PEP
#TSLA
#TWTR
Figure:
All
Triangle
Rectangle
Pennant
Flag
Head and Shoulders
Double Top
Triple top
Timeframe:
All
M5
M15
M30
H1
D1
Signal strength:
All
High
Medium
Low
Signal direction:
All
Buy
Sell
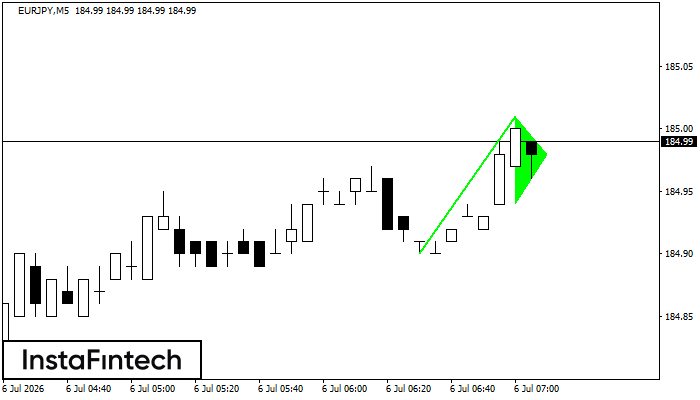
EURJPY M5
Bullish pennant
The Bullish pennant graphic pattern has formed on the EURJPY M5 instrument. This pattern type falls under the category of continuation patterns. In this case, if the quote can breaks out high, is expected to continue the upward trend to level 185.16.
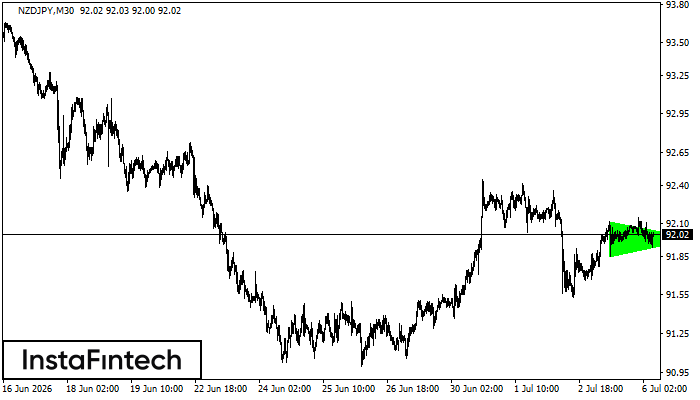
NZDJPY M30
Bullish Symmetrical Triangle
According to the chart of M30, NZDJPY formed the Bullish Symmetrical Triangle pattern. The lower border of the pattern touches the coordinates 91.85/91.99 whereas the upper border goes across 92.12/91.99. If the Bullish Symmetrical Triangle pattern is in progress, this evidently signals a further upward trend. In other words, in case the scenario comes true, the price of NZDJPY will breach the upper border to head for 92.29.
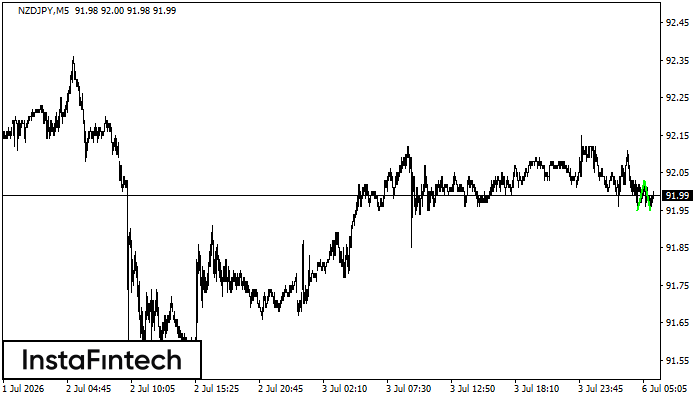
NZDJPY M5
Double Bottom
The Double Bottom pattern has been formed on NZDJPY M5. This formation signals a reversal of the trend from downwards to upwards. The signal is that a buy trade should be opened after the upper boundary of the pattern 92.03 is broken. The further movements will rely on the width of the current pattern 8 points.
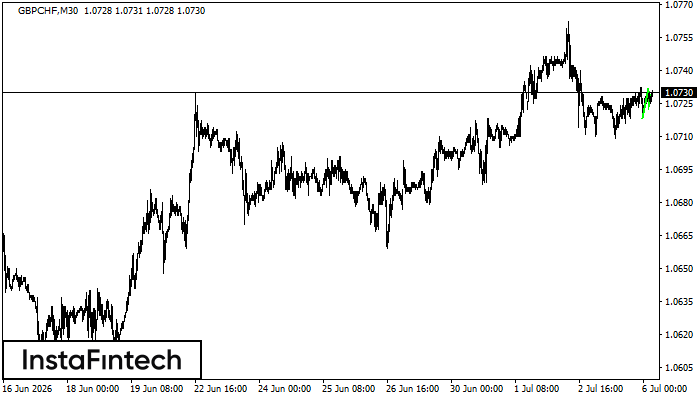
GBPCHF M30
Bullish pennant
The Bullish pennant signal – Trading instrument GBPCHF M30, continuation pattern. Forecast: it is possible to set up a buy position above the pattern’s high of 1.0732, with the prospect of the next move being a projection of the flagpole height.
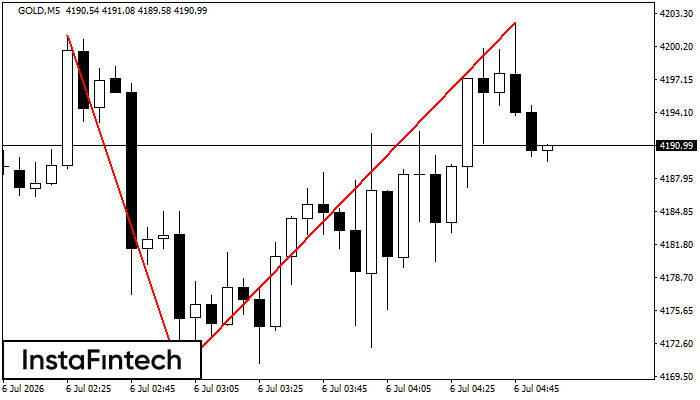
GOLD M5
Double Top
The Double Top pattern has been formed on GOLD M5. It signals that the trend has been changed from upwards to downwards. Probably, if the base of the pattern 4170.13 is broken, the downward movement will continue.
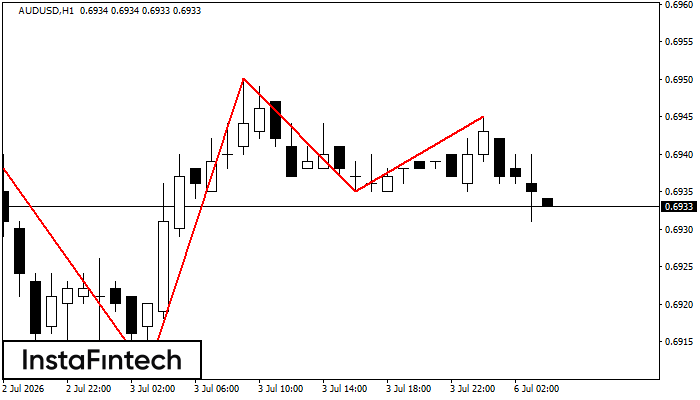
AUDUSD H1
Triple Top
The Triple Top pattern has formed on the chart of the AUDUSD H1 trading instrument. It is a reversal pattern featuring the following characteristics: resistance level -1, support level -24, and pattern’s width 33. Forecast If the price breaks through the support level 0.6911, it is likely to move further down to 0.6910.
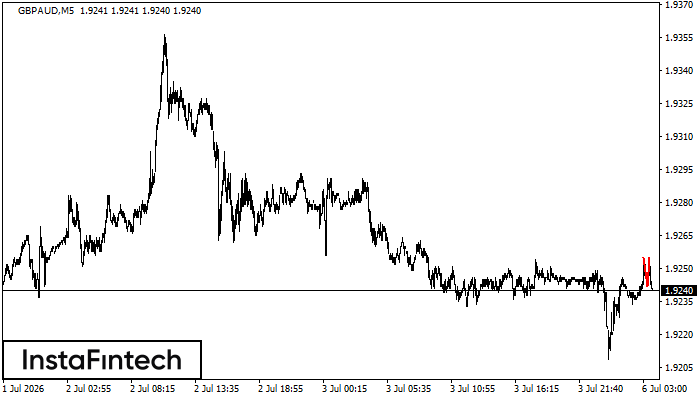
GBPAUD M5
Double Top
The Double Top pattern has been formed on GBPAUD M5. It signals that the trend has been changed from upwards to downwards. Probably, if the base of the pattern 1.9242 is broken, the downward movement will continue.
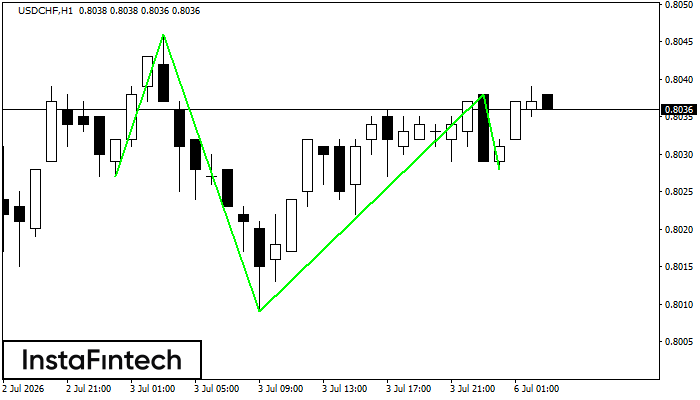
USDCHF H1
Inverse Head and Shoulder
According to the chart of H1, USDCHF produced the pattern termed the Inverse Head and Shoulder. The Head is fixed at 0.8009 while the median line of the Neck is set at 0.8046/0.8038. The formation of the Inverse Head and Shoulder Pattern clearly indicates a reversal of the downward trend. In means that in case the scenario comes true, the price of USDCHF will go towards 0.8078.
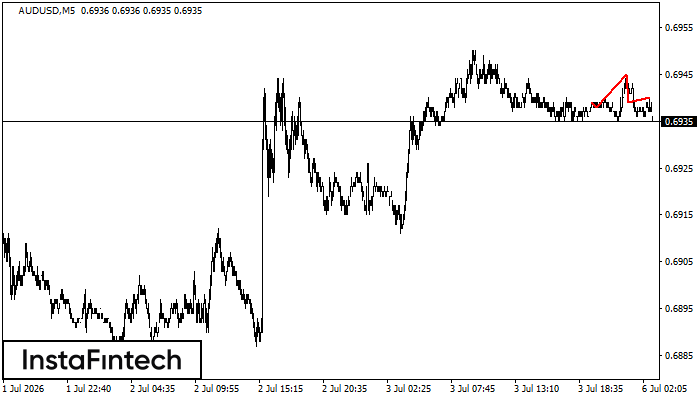
AUDUSD M5
Head and Shoulders
The technical pattern called Head and Shoulders has appeared on the chart of AUDUSD M5. There are weighty reasons to suggest that the price will surpass the Neckline 0.6938/0.6939 after the right shoulder has been formed. So, the trend is set to change with the price heading for 0.6924.
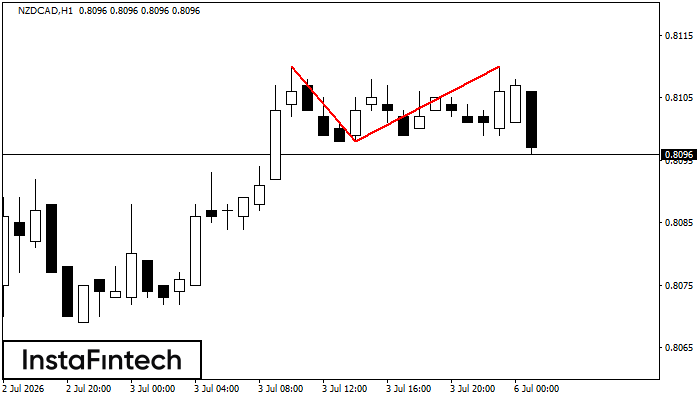
NZDCAD H1
Double Top
On the chart of NZDCAD H1 the Double Top reversal pattern has been formed. Characteristics: the upper boundary 0.8110; the lower boundary 0.8098; the width of the pattern 12 points. The signal: a break of the lower boundary will cause continuation of the downward trend targeting the 0.8058 level.