 English
  Русский
 Bahasa Indonesia
 Bahasa Malay
 ไทย
ไทย Español
 Deutsch
 Български
 Français
 Tiếng Việt
 中文
中文 বাংলা
বাংলা हिन्दी
 Čeština
 Українська
 Română

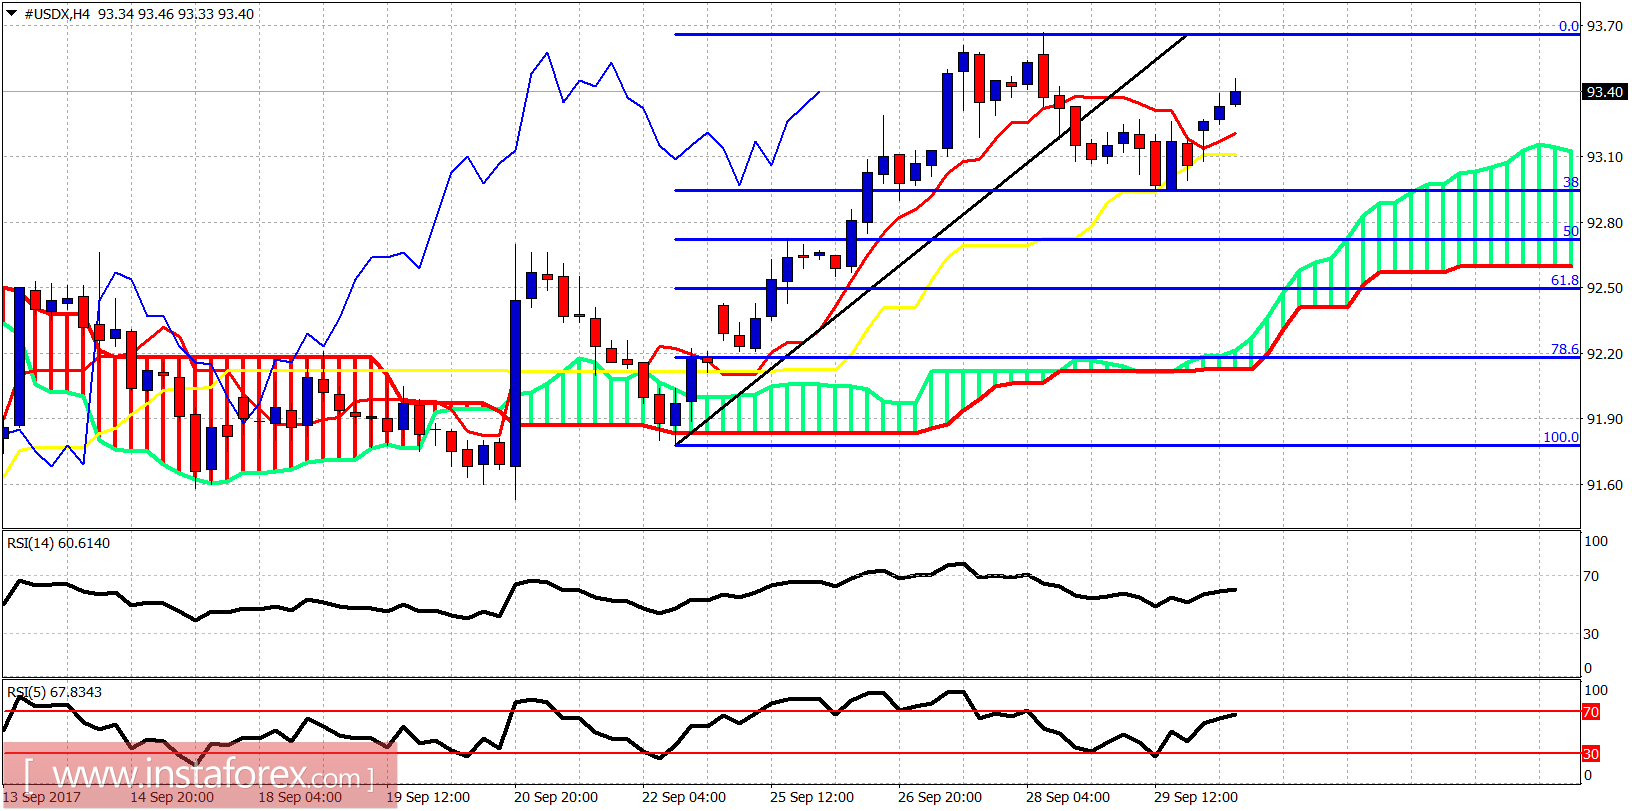
The Dollar index has made a shallow pullback towards the 38% Fibonacci retracement and started its bounce on Friday and continues today. Price is testing important daily resistance today. A rejection today will increase the chances that a major top was made last week.
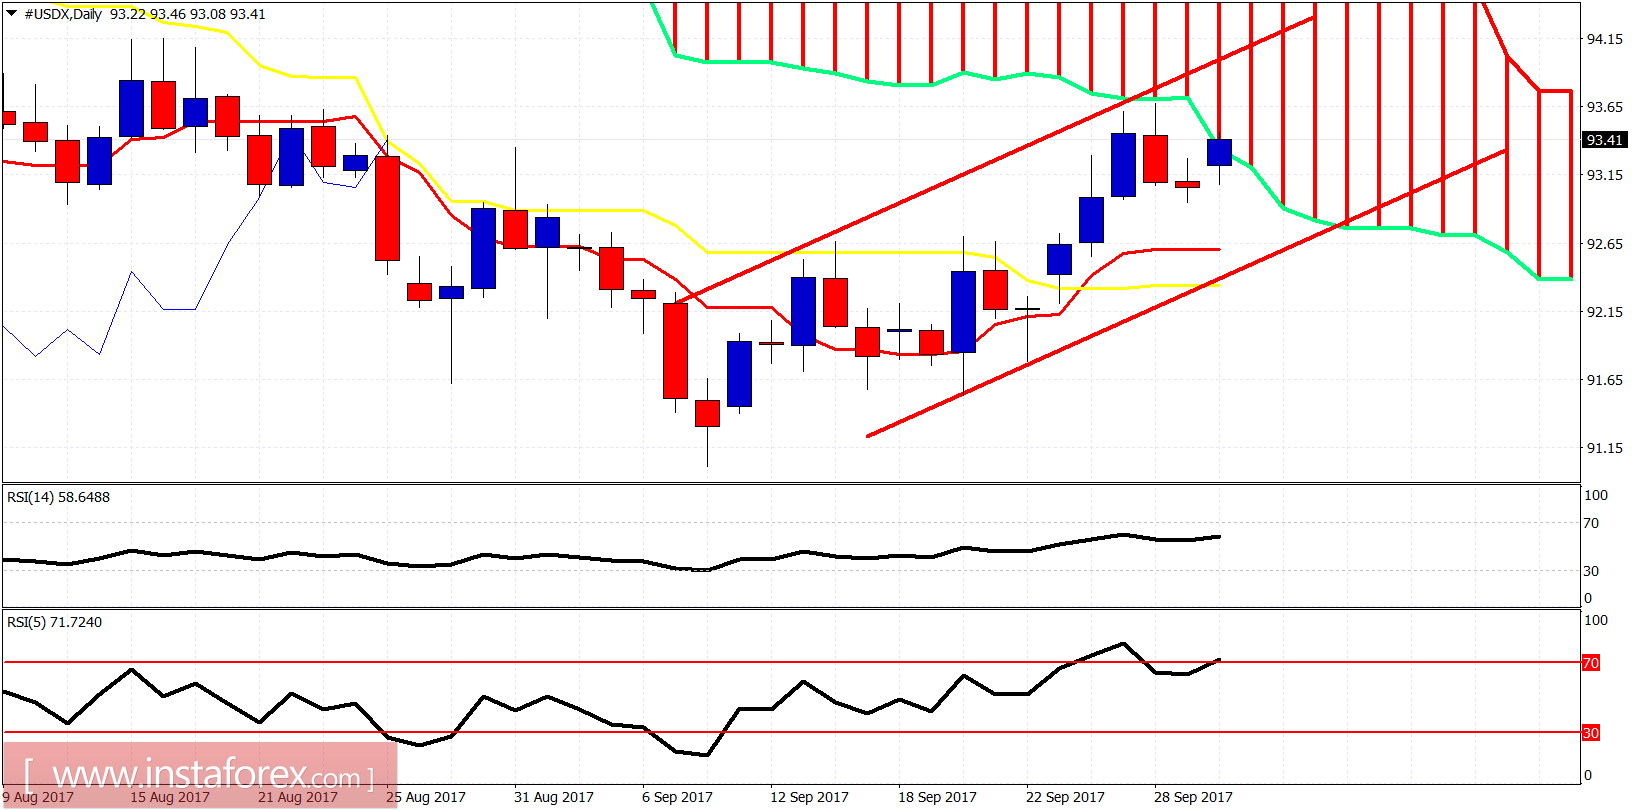
The Daily chart of the Dollar index shows price inside the bullish channel and testing the Kumo (cloud) resistance. Entering the cloud will turn daily trend to neutral from bearish. Support is at 92.95 on a daily basis. A daily close below 92.95 will open the way for a move towards 92.10 at least.