 English
  Русский
 Bahasa Indonesia
 Bahasa Malay
 ไทย
ไทย Español
 Deutsch
 Български
 Français
 Tiếng Việt
 中文
中文 বাংলা
বাংলা हिन्दी
 Čeština
 Українська
 Română

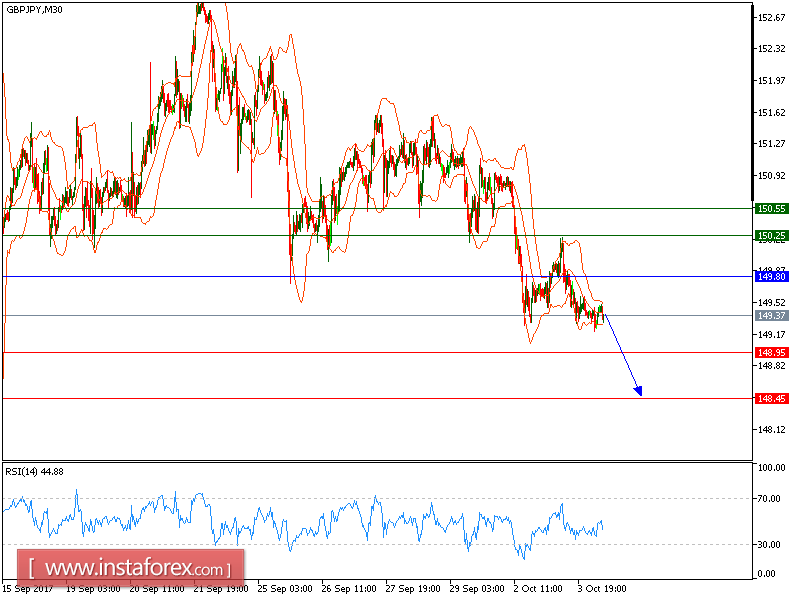
Our first target which we predicted in Yesterday's analysis has been hit. The pair remains under pressure below its key resistance at 149.80 and is likely to challenge its next support at 148.95 in the coming trading hours. The relative strength index is bearish below its neutrality area at 50.
In which case, as long as the resistance at 149.80 is not surpassed, the risk of the break below 148.95 remains high. Our next downside target is set at 148.45.
Alternatively, if the price moves in the direction opposite to the forecast, a long position is recommended above 149.80 with the target at 150.25.
Strategy: SELL, Stop Loss: 149.80, Take Profit: 148.95
Chart Explanation: the black line shows the pivot point. The price above the pivot point indicates long positions; and when it is below the pivot points, it indicates short positions. The red lines show the support levels and the green line indicates the resistance levels. These levels can be used to enter and exit trades.
Resistance levels: 150.25, 150.55 and 151.00
Support levels: 148.95, 148.45, and 147.75