 English
  Русский
 Bahasa Indonesia
 Bahasa Malay
 ไทย
ไทย Español
 Deutsch
 Български
 Français
 Tiếng Việt
 中文
中文 বাংলা
বাংলা हिन्दी
 Čeština
 Українська
 Română

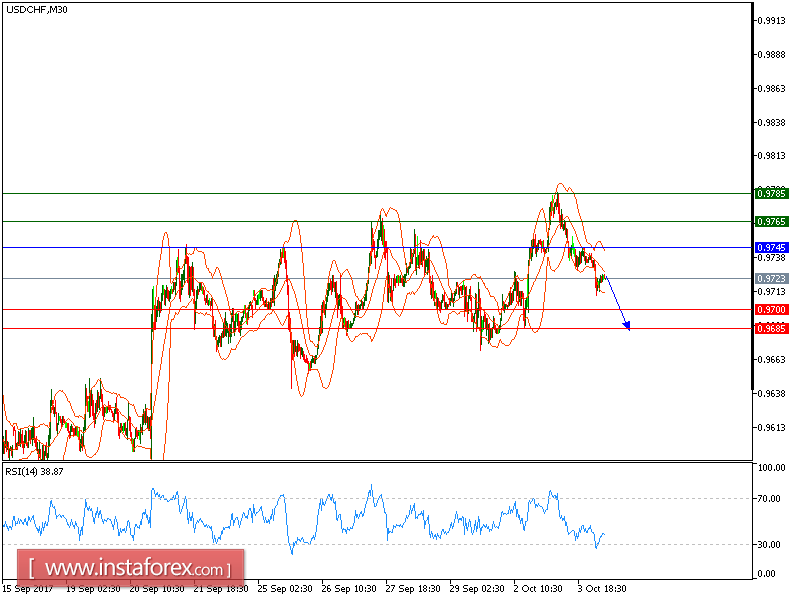
USD/CHF is under pressure. The pair broke below its lower boundary of Bollinger Bands, which confirmed the continuation of the bearish trend. The downward momentum is further reinforced by both 20-period and 50-period moving averages. The relative strength index has broken down its oversold level at 30.
To sum up, below 0.9745, look for a new test to 0.9700 and even to 0.9685 in extension.
Chart Explanation: The black line shows the pivot point. The present price above the pivot point indicates a bullish position, and the price below the pivot points indicates a short position. The red lines show the support levels and the green line indicates the resistance levels. These levels can be used to enter and exit trades.
Strategy: SELL, Stop Loss: 0.9745, Take Profit: 0.9700
Resistance levels: 0.9765, 0.9785, and 0.9805
Support levels: 0.9700, 0.9685, and 0.9625