English
  Русский
 Bahasa Indonesia
 Bahasa Malay
 ไทย
ไทย Español
 Deutsch
 Български
 Français
 Tiếng Việt
 中文
中文 বাংলা
বাংলা हिन्दी
 Čeština
 Українська
 Română

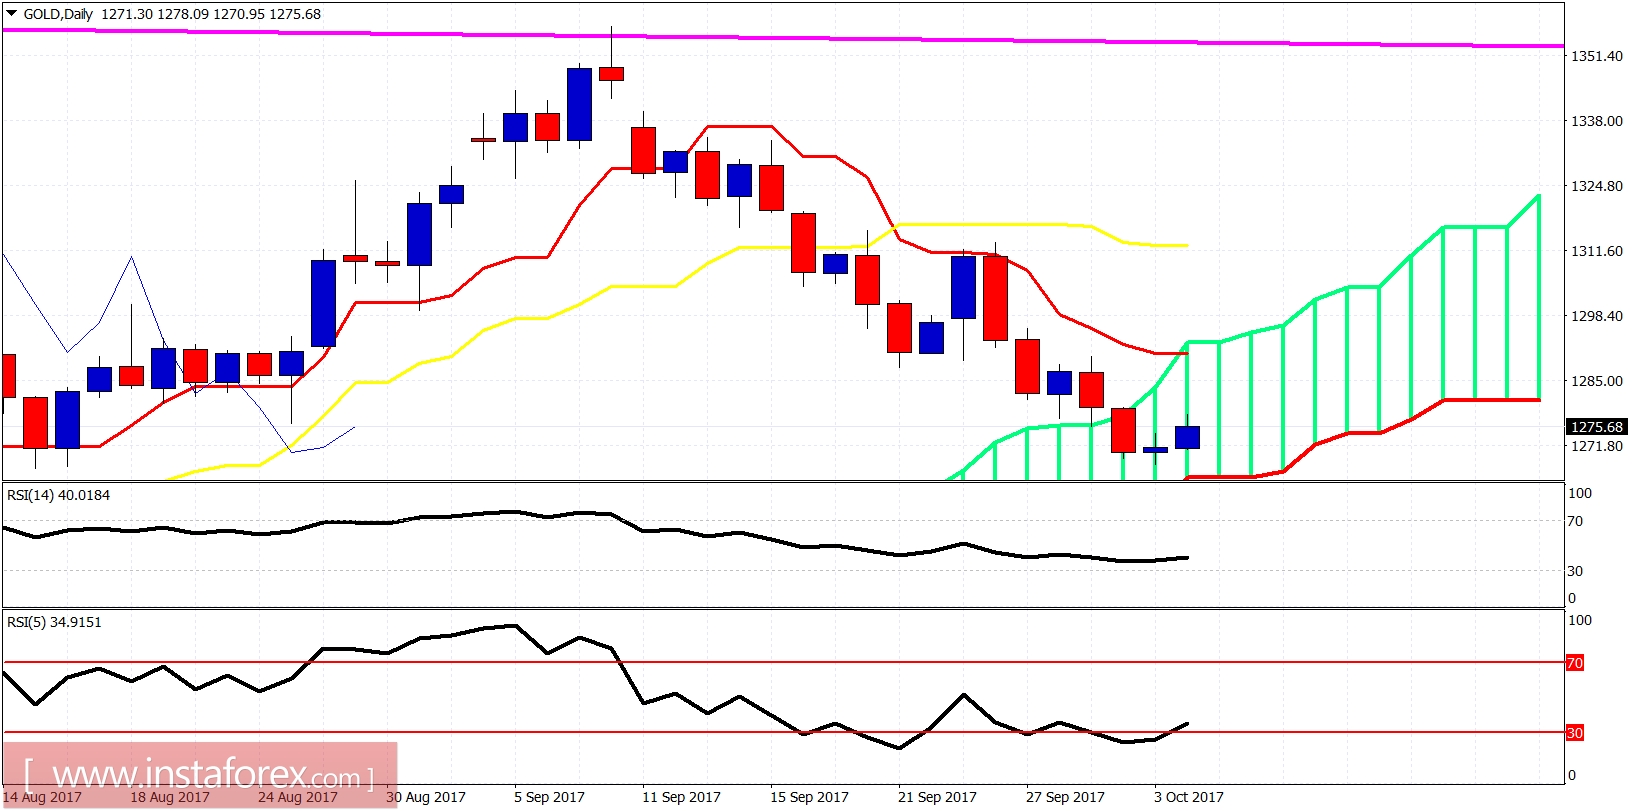
Gold price has broken out of the downward sloping triangle pattern. Both RSI indicators have suggested that a bounce was imminent. Minimum target for the bounce is the $1,295 area.
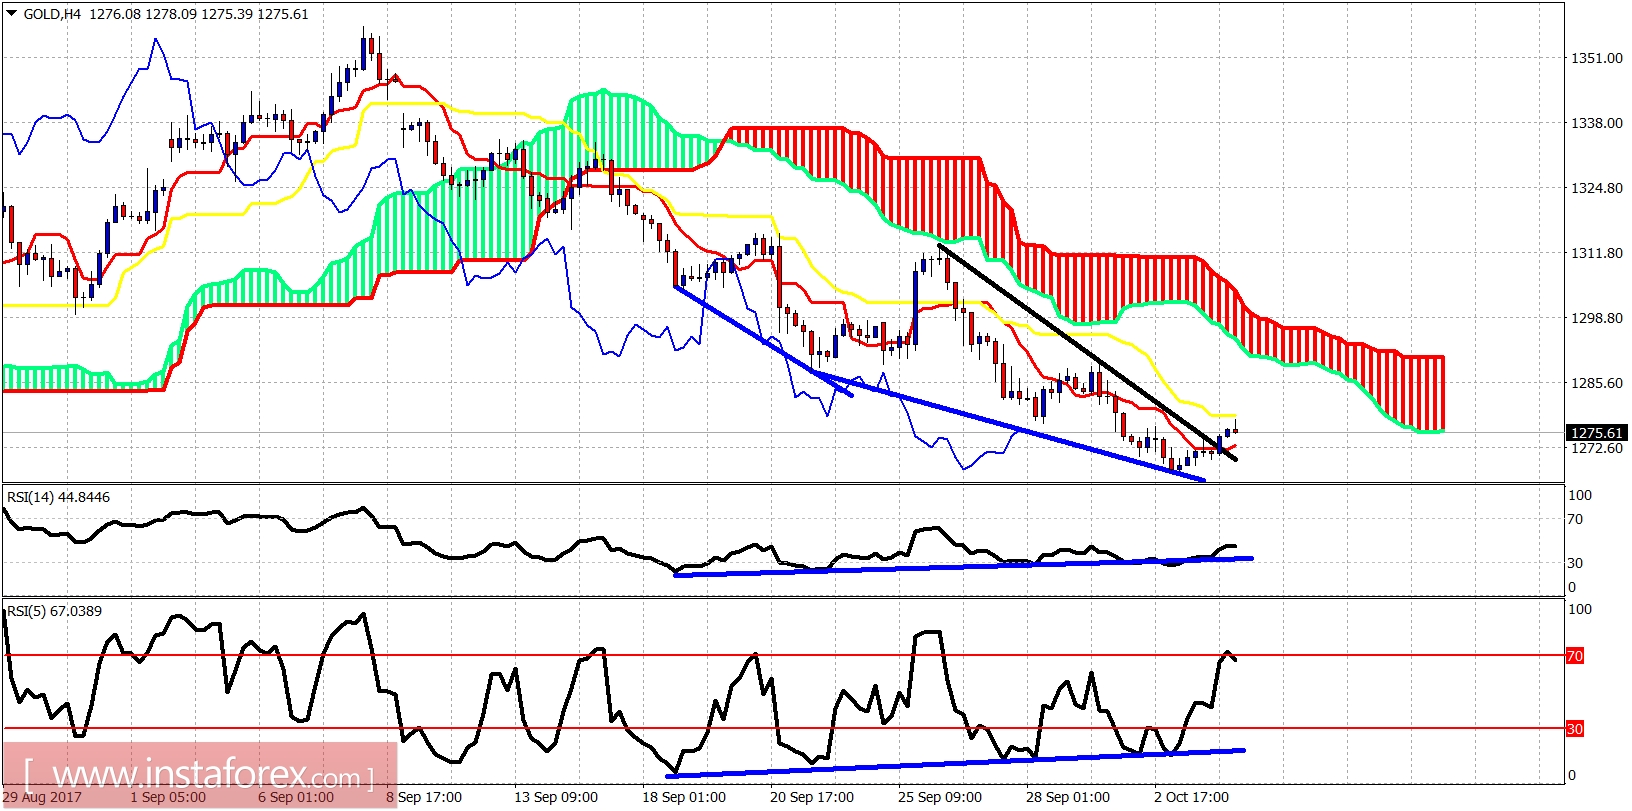
Blue lines - bullish divergence signs
Gold price has broken above the triangle pattern and is bouncing towards the Ichimoku cloud resistance of $1,288. Support is at $1,268 now and if broken we should expect a move towards $1,260-50. Trend remains bearish as long as price is below $1,316.