 English
  Русский
 Bahasa Indonesia
 Bahasa Malay
 ไทย
ไทย Español
 Deutsch
 Български
 Français
 Tiếng Việt
 中文
中文 বাংলা
বাংলা हिन्दी
 Čeština
 Українська
 Română

The index plummeted following the US NFP poor outcome for September and now it looks forward to testing the 200 SMA at H1 chart. Around that area, USDX is poised to do a rebound in order to resume the bullish bias shown in the short-term. If it manages to break above 94.04, next target should be the 94.58 level. MACD indicator remains in the negative territory.
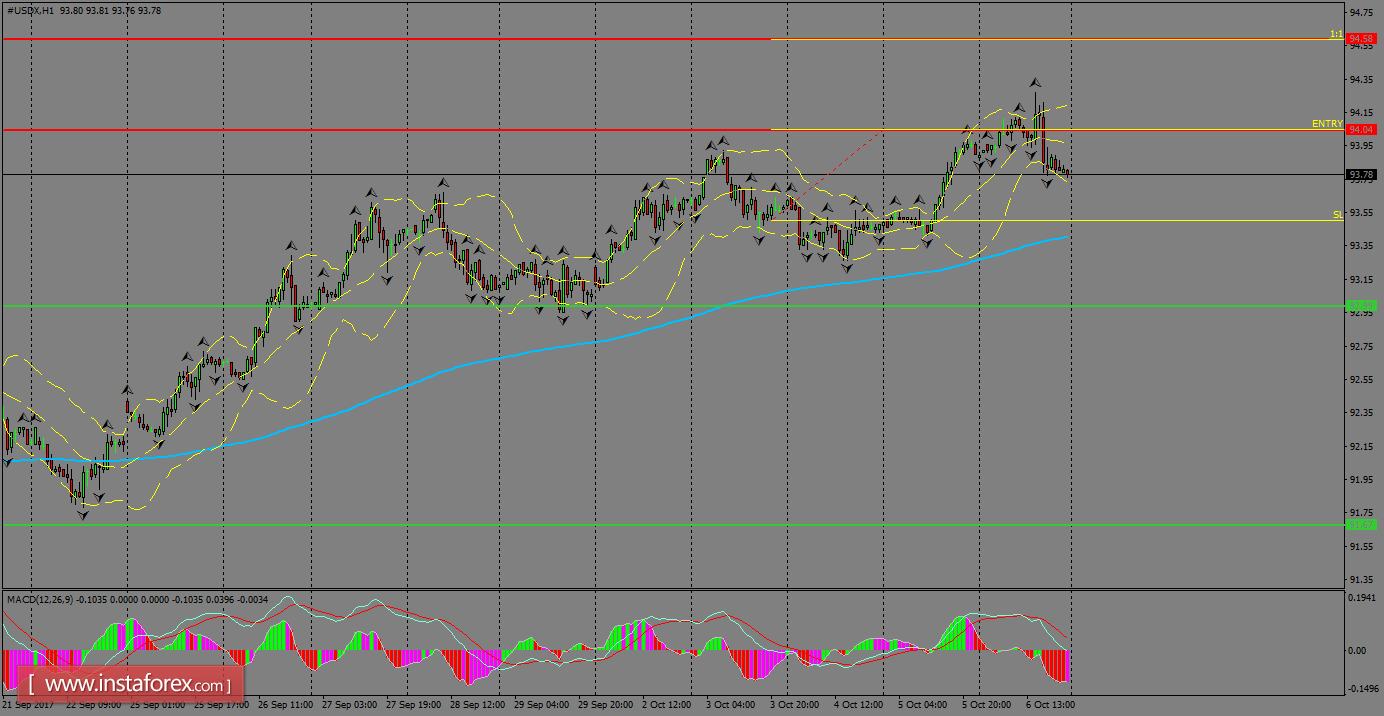
H1 chart's resistance levels: 94.04 / 94.58
H1 chart's support levels: 93.00 / 91.67
Trading recommendations for today: Based on the H1 chart, place buy (long) orders only if the USD Index breaks with a bullish candlestick; the resistance level is at 94.04, take profit is at 94.58 and stop loss is at 93.50.