 English
  Русский
 Bahasa Indonesia
 Bahasa Malay
 ไทย
ไทย Español
 Deutsch
 Български
 Français
 Tiếng Việt
 中文
中文 বাংলা
বাংলা हिन्दी
 Čeština
 Українська
 Română

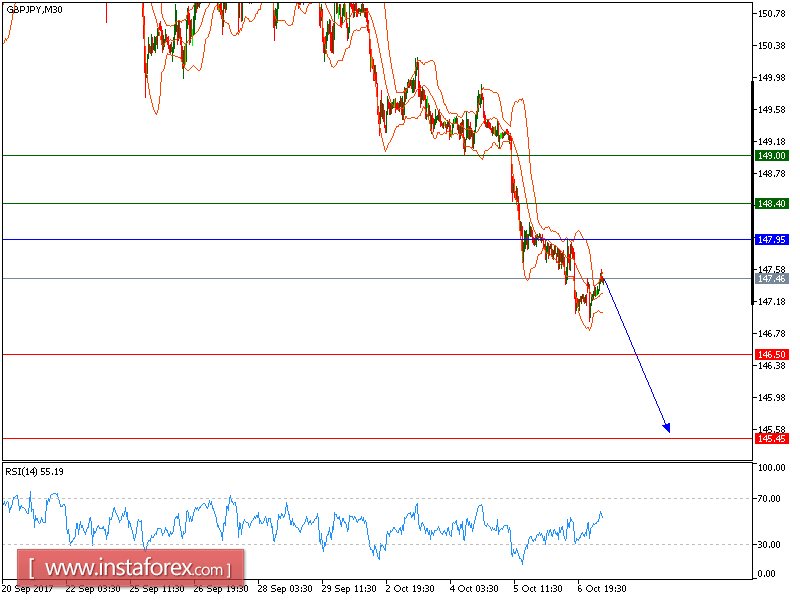
Our first target which we predicted in Yesterday's analysis has been hit. The pair posted an intraday "V-top" pattern last Friday and is likely to extend its losses in the coming trading hours. The horizontal level at 147.95 plays well a resistance role. In addition, the relative strength index is below its neutrality area at 50 and lacks upward momentum.
Therefore, as long as 147.95 holds on the upside, look for a new pullback to 146.50 and 145.45 in extension.
Alternatively, if the price moves in the direction opposite to the forecast, a long position is recommended above 147.95 with the target at 148.40.
Strategy: SELL, Stop Loss: 147.95, Take Profit: 146.50
Chart Explanation: the black line shows the pivot point. The price above the pivot point indicates long positions; and when it is below the pivot points, it indicates short positions. The red lines show the support levels and the green line indicates the resistance levels. These levels can be used to enter and exit trades.
Resistance levels: 148.40, 149.00 and 149.55
Support levels: 146.50, 145.45, and 145.00