 English
  Русский
 Bahasa Indonesia
 Bahasa Malay
 ไทย
ไทย Español
 Deutsch
 Български
 Français
 Tiếng Việt
 中文
中文 বাংলা
বাংলা हिन्दी
 Čeština
 Українська
 Română

Gold price is trading higher after the reversal on Friday. We have been warning Gold bears that the bullish divergence signs combined with the important support of 61.8% Fibo at $1,260 justified a strong bounce. However we do not see this as just a bounce but the start of a bigger move higher.
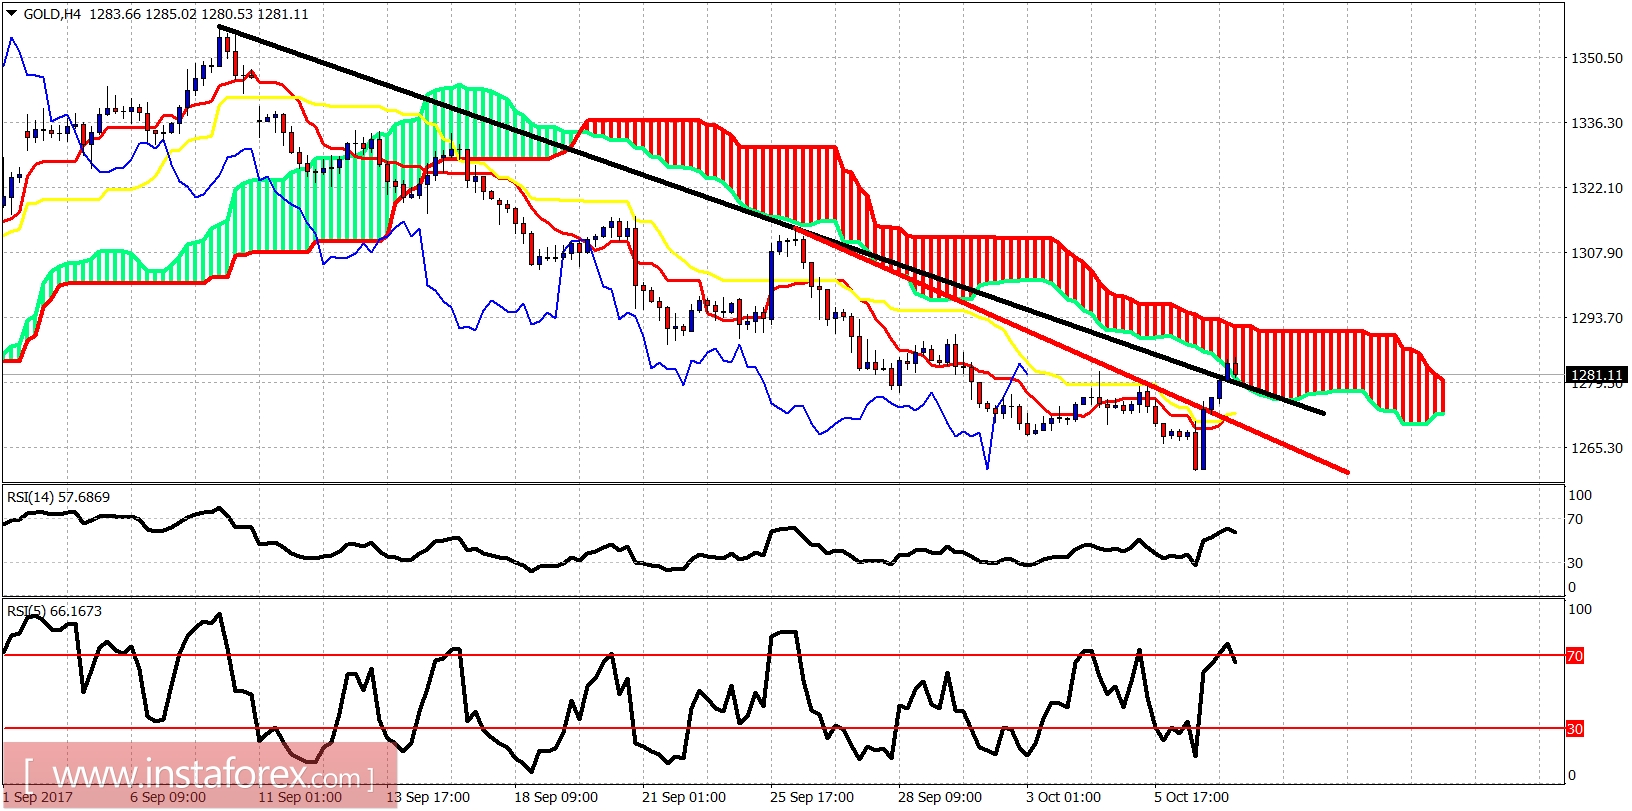
Black line - resistance (broken)
Red line - resistance (broken)
Gold price has made an important low at $1,260. I believe we have started the next leg up towards $1,400. I'm very bullish Gold. Short-term support is now at $1,272. Resistance is at $1,293 and next at $1,316. Breaking above these levels will open up the way towards $1,350-75.
