 English
  Русский
 Bahasa Indonesia
 Bahasa Malay
 ไทย
ไทย Español
 Deutsch
 Български
 Français
 Tiếng Việt
 中文
中文 বাংলা
বাংলা हिन्दी
 Čeština
 Українська
 Română

The Dollar index is showing reversal signs of the daily Ichimoku cloud resistance at 94. Price remains inside the bearish channel however we do not have a confirmation that a new downward move has started.
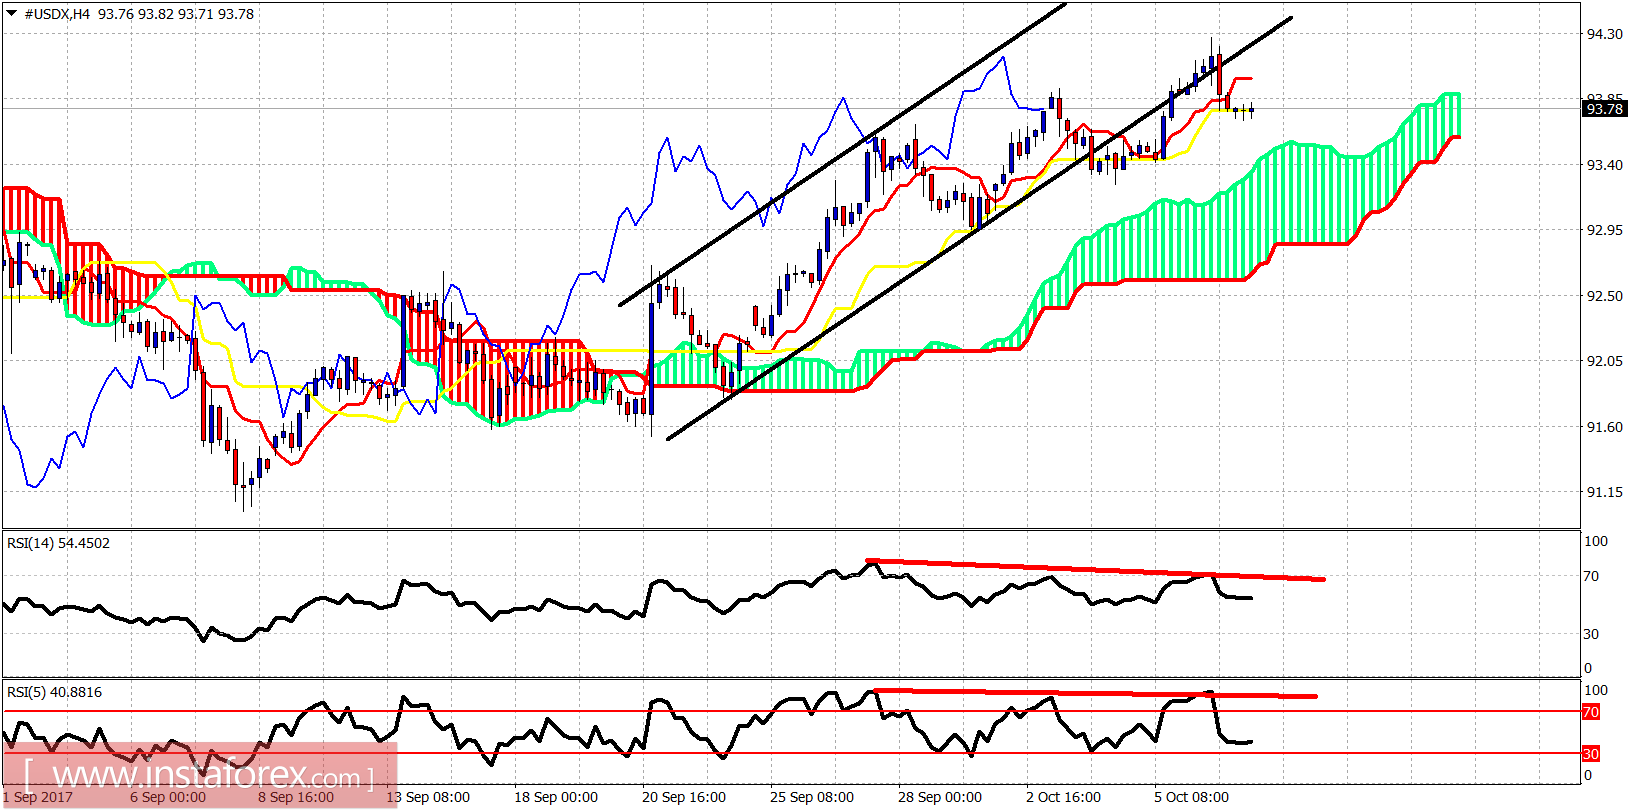
Red lines - bearish divergence signs
The Dollar index continues to trade above the 4-hour Kumo (cloud) support. Trend remains bullish as price is making higher highs and higher lows. However there are several warning signs justifying a full-scale reversal. Both RSI are diverging. Price has broken below the bullish channel. Price is at important resistance.
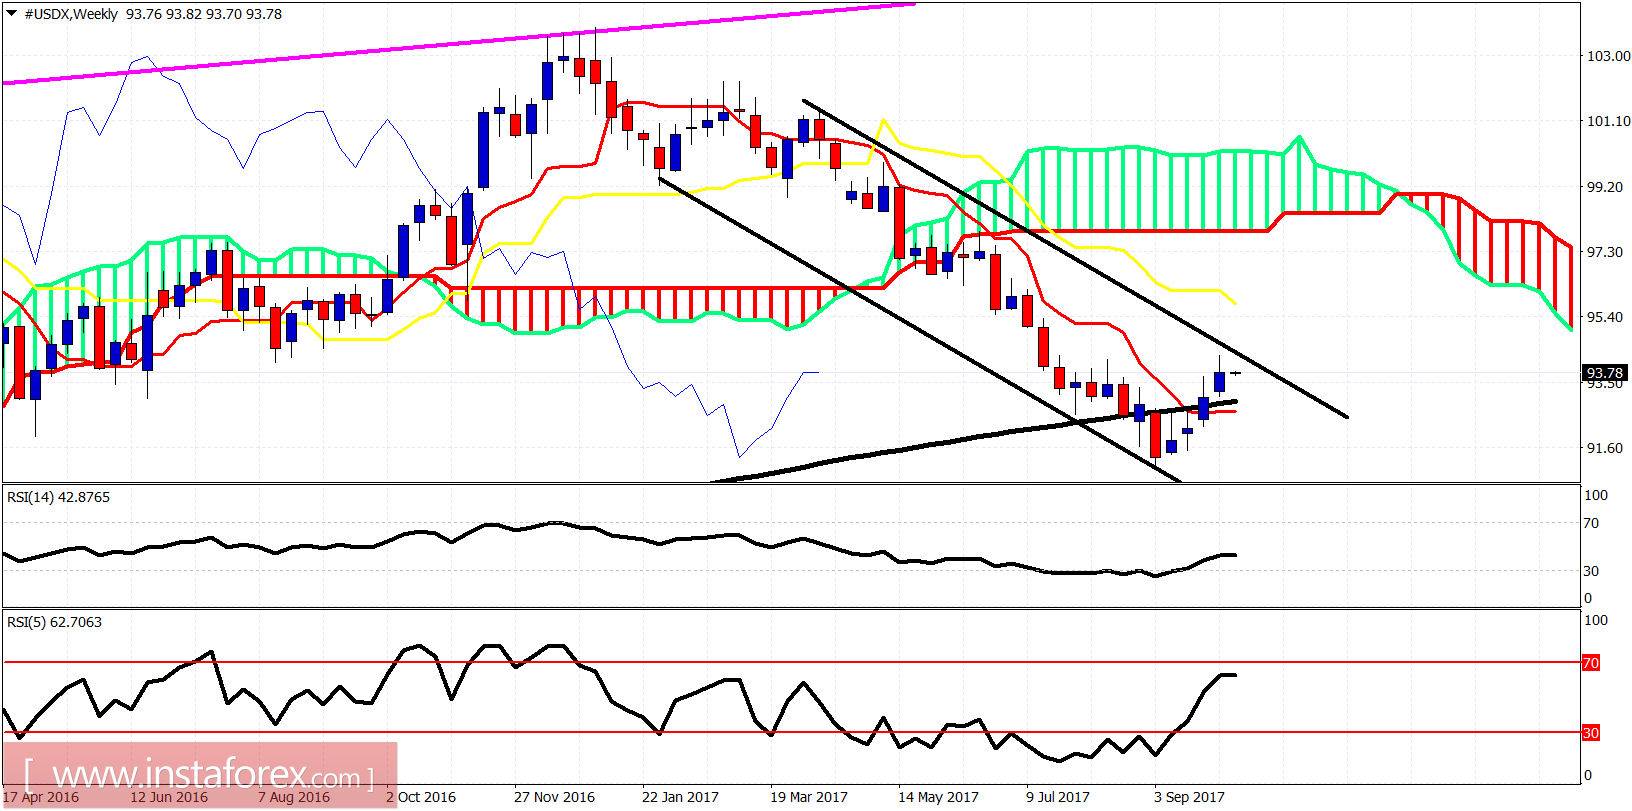
On a weekly basis price remains inside the bearish channel. Price has reached the upper channel boundary and is showing signs of rejection. However only a break below 93 would confirm the bigger reversal in prices. My view is that we will see that reversal materialize.